Quantcast
Channel: Figure window – Undocumented Matlab
Viewing all 45 articles
Browse latest View live

Modifying default toolbar/menubar actions

$
0
0

Did you ever wish to modify Matlab’s default toolbar/menubar items?

I recently consulted to a client who needed to modify the default behavior of the legend action in the toolbar, and the corresponding item on the main menu (Insert / Legend). The official version is that only user-added items can be customized, whereas standard Matlab items cannot.

Luckily, this can indeed be done using simple pure-Matlab code. The trick is to get the handles of the toolbar/menubar objects and then to modify their callback properties.
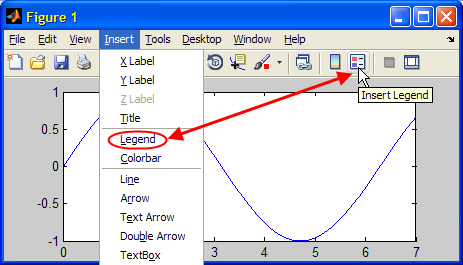
Default legend insertion action

Default legend insertion action

Using the toolbar/menubar item handles

Getting the handles can be done in several different ways. In my experience, using the object’s tag string is often easiest, fastest and more maintainable. Note that the Matlab toolbar and main menu handles are normally hidden (HandleVisibility = ‘off’). Therefore, in order to access them we need to use the findall function rather than the better-known findobj function. Also note that to set the callbacks we need to access differently-named properties: ClickedCallback for toolbar buttons, and Callback for menu items:

hToolLegend = findall(gcf,'tag','Annotation.InsertLegend');
set(hToolLegend, 'ClickedCallback',{@cbLegend,hFig,myData});
 
hMenuLegend = findall(gcf,'tag','figMenuInsertLegend');
set(hMenuLegend, 'Callback',{@cbLegend,hFig,myData});

As a side note, two undocumented/unsupported functions, uitool(hFig,tagName) and uigettoolbar, also retrieve toolbar items. Since using findall is so simple and more supported, I suggest using the findall approach.

To see the list of available toolbar/menubar tags, use the following code snippet:

% Toolbar tag names:
>> hToolbar = findall(gcf,'tag','FigureToolBar');
>> get(findall(hToolbar),'tag')
ans = 
    'FigureToolBar'
    'Plottools.PlottoolsOn'
    'Plottools.PlottoolsOff'
    'Annotation.InsertLegend'
    'Annotation.InsertColorbar'
    'DataManager.Linking'
    'Exploration.Brushing'
    'Exploration.DataCursor'
    'Exploration.Rotate'
    'Exploration.Pan'
    'Exploration.ZoomOut'
    'Exploration.ZoomIn'
    'Standard.EditPlot'
    'Standard.PrintFigure'
    'Standard.SaveFigure'
    'Standard.FileOpen'
    'Standard.NewFigure'
    ''
 
% Menu-bar tag names:
>> get(findall(gcf,'type','uimenu'),'tag')
ans = 
    'figMenuHelp'
    'figMenuWindow'
    'figMenuDesktop'
    'figMenuTools'
    'figMenuInsert'
    'figMenuView'
    'figMenuEdit'
    'figMenuFile'
    'figMenuHelpAbout'
    'figMenuHelpPatens'
    'figMenuHelpTerms'
    'figMenuHelpActivation'
    'figMenuDemos'
    'figMenuTutorials'
    'figMenuHelpUpdates'
    'figMenuGetTrials'
    'figMenuWeb'
    'figMenuHelpPrintingExport'
    'figMenuHelpAnnotatingGraphs'
    'figMenuHelpPlottingTools'
    'figMenuHelpGraphics'
    ''
    ''                    < = Note the missing tag names...
    ''
    'figMenuToolsBFDS'    <= note the duplicate tag names...
    'figMenuToolsBFDS'
    'figDataManagerBrushTools'
    'figMenuToolsAlign'
    'figMenuToolsAlign'
    ... (plus many many more...)

Unfortunately, as seen above, Matlab developers forgot to assign tags to some default toolbar/menubar items. Luckily, in my particular case, both legend handles (toolbar, menu) have valid tag names that can be used: ‘Annotation.InsertLegend’ and ‘figMenuInsertLegend’.

If an item’s tag is missing, you can always find its handle using its Parent, Label, Tooltip or Callback properties. For example:

hPrintMenuItem = get(findall(gcf,'Label','&Print...'));

Note that property values, such as the tag names or labels, are unsupported and undocumented. They may change without warning or notice between Matlab releases, and have indeed done so in the past. Therefore, if your code needs to be compatible with older Matlab releases, ensure that you cover all the possible property values, or use a different way to access the handles. While using the tag name or label as shown above is considered "Low risk" (I don't expect it to break in the near future), their actual values should be considered somewhat more risky and we should therefore code defensively.

Another simple example: Print Preview

As another simple and very useful example, let's modify the default Print action (and tooltip) on the figure toolbar to display the Print-Preview window rather than send the figure directly to the printer:

Matlab's default toolbar Print action

Matlab's default toolbar Print action

hToolbar = findall(gcf,'tag','FigureToolBar');
hPrintButton = findall(hToolbar,'tag','Standard.PrintFigure');
set(hPrintButton, 'ClickedCallback','printpreview(gcbf)', ...
                  'TooltipString','Print Preview');
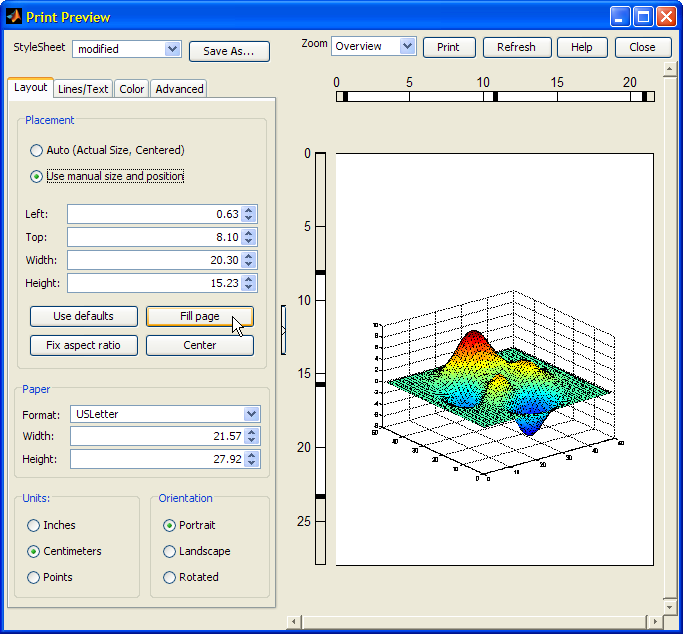
Matlab's Print Preview window

Matlab's Print Preview window

More advanced customization of the toolbar and menu items are possible, but require a bit of Java code. Examples of toolbar customizations were presented in past articles (here and here). A future article will explain how to customize menu items.

Have you found a nifty way to customize the menubar or toolbar? If so, please share it in the comments section below.

 
Related posts:
  1. Customizing the standard figure toolbar, menubar The standard figure toolbar and menubar can easily be modified to include a list of recently-used files....
  2. Getting default HG property values Matlab has documented how to modify default property values, but not how to get the full list of current defaults. This article explains how to do this. ...
  3. Customizing figure toolbar background Setting the figure toolbar's background color can easily be done using just a tiny bit of Java magic powder. This article explains how. ...
  4. uicontrol side-effect: removing figure toolbar Matlab's built-in uicontrol function has a side-effect of removing the figure toolbar. This was undocumented until lately. This article describes the side-effect behavior and how to fix it....
 

Tab panels – uitab and relatives

$
0
0

In the past year, readers of this blog have used its search box thousands of times. Can you guess what the top search terms are?

It turns out that 7 of the top 15 search terms relate to tables, trees and tab-panes.

These items are related in being standard GUI elements that unfortunately have very lacking support in Matlab. They all have corresponding functions in the %matlabroot%/toolbox/matlab/uitools folder, which was already introduced here as containing many unsupported GUI functions. Specifically, uitable for tables (this became supported in R2008a, but even the supported version has many important undocumented aspects); uitree and uitreenode for trees; and uitab and uitabgroup for tab-panes, which are today’s subject. Future articles will describe tables, trees and tab-panes in more detail.

uitab & uitabgroup

Like most other uitools, the uitab and uitabgroup functions are semi-documented, meaning that they have no support or doc-page, but do have readable help sections within their m-files. In our case, edit the uitab.m and uitabgroup.m files to see their help section.

Available since 2004 (R14 SP2, aka 7.0.4), Matlab’s uitabgroup uses the Matlab Java widget com.mathworks.hg.peer.UITabGroupPeer, which extends the standard javax.swing.JTabbedPane. Unlike uitable and uitree, which use actual Java objects to both store and present the data, uitabgroup only sets up the Java object to display the tabs, whereas the tab contents themselves are placed in entirely unrelated Matlab uicontainers. Matlab uses very clever double-booking to keep the Java and Matlab objects synchronized. The ability to “switch” tabs is actually a deception: in reality, a listener placed on the SelectedIndex property of the tab group causes the relevant Matlab container to display and all the rest to become hidden. Other listeners control containers’ position and size based on the tab group’s. Adding and removing tabs uses similar methods to add/remove empty tabs to the JTabbedPane. Read uitabgroup‘s schema.m for details.

A drawback of this complex mechanism is the absence of a single customizable Java object. The benefit is that it allows us to place any Matlab content within the tabs, including plot axes which cannot be added to Java containers. Had uitabgroup been a Java container, we could not add axes plots or images to its tabs. In my humble opinion, Matlab’s tab implementation is an ingenious piece of engineering.

Here’s a simple tab-group adapted from uitabgroup‘s help section:

hTabGroup = uitabgroup; drawnow;
tab1 = uitab(hTabGroup, 'title','Panel 1');
a = axes('parent', tab1); surf(peaks);
tab2 = uitab(hTabGroup, 'title','Panel 2');
uicontrol(tab2, 'String','Close', 'Callback','close(gcbf)');

(recent Matlab releases throw a warning when using this code: either add the ‘v0′ input arg to uitabgroup and uitab calls, or suppress the MATLAB:uitabgroup:MigratingFunction warning)

Here, the returned uitabgroup object hTabGroup is actually a Matlab container (deriving from uiflowcontainer) that always displays two elements: the Java tab-group, and the active Matlab uicontainer (the active tab’s contents). Understanding this, hTabGroup’s FlowDirection property becomes clear. However, it is better to use hTabGroup’s TabLocation property, which accepts ‘top’, ‘bottom’, ‘left’ and ‘right’:

TabLocation = 'top'

TabLocation = 'top'

TabLocation = 'left'

TabLocation = 'left'

Another hTabGroup property of interest is Margin, which sets the margin in pixels before each of the displayed elements – not just between them as might be expected: Increasing Margin (default=2 pixels) increases the gap between the tab group and the active tab’s contents, but also the gap between the tab group and figure edge:

TabLocation = 'bottom', Margin = 20   TabLocation = 'left', Margin = 20

Margin = 20

Tabs can be selected programmatically, by setting hTabGroup’s SelectedIndex property. Reading this property is useful when setting tab-selection callbacks using the SelectionChangeFcn property:

set(hTabGroup,'SelectionChangeFcn',@myCallbackFcn);
set(hTabGroup,'SelectedIndex',2);   % activate second tab

Edit Oct 27 2010: R2010b made a few changes to the hTabGroup properties: SelectedTab has been added (holds the handle of the selected tab, rather than its index as SelectedIndex; note that SelectedTab was added as a hidden property for some unknown reason, probably a programming mistake); the tab BackgroundColor cannot be modified (I’ll show how to bypass this limitation in a near-future article); SelectionChangeFcn callback and the SelectionChanged event have changed their names to SelectionChangeCallback and SelectionChange respectively. Note that this is one of the very rare occasions in which MathWorks have taken the trouble to notify users about changes to one of their undocumented/unsupported functions. They should be commended for this since it helps us Matlab users make better use of the product.

Additional control over the tab group’s behavior can be achieved by customizing the underlying Java object. This object is not directly exposed by uitabgroup, but can be found using the FindJObj utility, or via the hidden ApplicationData (this alternative only works on R2014a or earlier!). Remember that Java objects use 0-based indexing so tab #1 is actually the second tab. Also remember that HTML is accepted just as in any other Swing-based label:

% Get the underlying Java reference using FindJObj
jTabGroup = findjobj('class','JTabbedPane');
 
% A direct alternative for getting jTabGroup (only works up to R2014a!)
jTabGroup = getappdata(handle(hTabGroup),'JTabbedPane');
 
% Now use the Java reference to set the title, tooltip etc.
jTabGroup.setTitleAt(1,'Tab #2');
jTabGroup.setTitleAt(1,'<html><b><i><font size=+2>Tab #2');
jTabGroup.setToolTipTextAt(1,'Tab #2');
 
% Disabling tabs can only be done using the Java handle:
jTabGroup.setEnabledAt(1,0);  % disable only tab #1 (=2nd tab)
jTabGroup.setEnabled(false);  % disable all tabs

A future post will describe tab customization, including fonts, colors, icons and even addition of close buttons as in modern web browsers.

tabdlg

tabdlg is a related semi-documented and unsupported uitool that, like uitabgroup, creates a tabbed user interface. However, unlike uitabgroup, tabdlg uses plain-vanilla Matlab, without reliance on Java (well, actually all Matlab GUI controls ultimately rely on Java, but tabdlg does not use any Java beyond that). The end result looks less professional than uitabgroup, but it works even when Java does not.

tabdlg has an extensive help section, so it will not be detailed here. In brief, the input parameters specify the tab labels, dimensions, offsets, callbacks, font, default tab, sheet dimensions and parent figure. Here is a sample usage, taken from tabdlg‘s help section. This code is executed whenever tabdlg is invoked without any input arguments:

tabdlg left tab

tabdlg left tab

tabdlg right tab

tabdlg right tab

File Exchange alternatives

There are many implementations of tab panels in the Matlab File Exchange. Matlab’s official Desktop Blog had an article about one specific example, which was that week’s Peek of the Week, and relied on adjacent buttons that are easy to implement, but in my personal opinion are a far cry from our expectations of a tab panel.

Better FEX utilities are: Multiple Tab GUI, Highlight Tab Objects easily, and best of all: uitabpanel or TabPanel Constructor.

Another very recent submission was this week’s POTW. This utility gives a professional (although somewhat non-standard) look, and is very easy to program – an excellent utility indeed.

All of the numerous tab-panel FEX utilities, as well as the fact that tab-panels are one of the most searched-for terms in this website, indicate the Matlab community’s desire to have supported native-looking tab-panel GUI in Matlab. Perhaps after 6 years it is time to bring uitab and uitabgroup into the light?

 
Related posts:
  1. Uitab customizations This article shows several customizations that can be done to Matlab's undocumented tab-panels functionality...
  2. Uitab colors, icons and images Matlab's semi-documented tab panels can be customized using some undocumented hacks...
  3. Matlab layout managers: uicontainer and relatives Matlab contains a few undocumented GUI layout managers, which greatly facilitate handling GUI components in dynamically-changing figures....
  4. Syntax highlighted labels & panels Syntax-highlighted labels and edit-boxes can easily be displayed in Matlab GUI - this article explains how. ...
 

GUI automation using a Robot

$
0
0

I would like to welcome guest writer Takeshi (Kesh) Ikuma. Kesh has posted several interesting utilities on the Matlab File Exchange, including the award-winning Enhanced Input Dialog Box. Today, Kesh will describe how we can automate GUI actions programmatically.

Automating GUI actions, including controlling a mouse and keyboard programmatically, is often useful. This can be used, for example, to demonstrate GUI usage or to perform a recorded macro.

Matlab’s Handle Graphics interface provides a simple way to manipulate the mouse cursor position, but not to emulate mouse or keyboard clicks. However, we can utilize Java’s java.awt.Robot class.

This article provides an overview of the Robot class and how it can be used to program mouse movement, button clicks and keyboard strikes.

java.awt.Robot class

The online Java documentation describes the purpose of the Robot class as follows:
This class is used to generate native system input events for the purposes of test automation, self-running demos, and other applications where control of the mouse and keyboard is needed.

This class has three main functionalities: mouse control, keyboard control, and screen capture. Here are some of the important member functions:

Mouse control functions

void mouseMove(int x, int y)

This function moves the cursor to the coordinate (x, y) which is defined with respect to the top-left screen corner (in contrast to Matlab’s coordinate origin at the bottom-left corner).

void mousePress(int buttons)
void mouseRelease(int buttons)

This pair of functions performs the button click. Their input argument is an OR’ed combination of java.awt.event.InputEvents:

java.awt.event.InputEvent.BUTTON1_MASK   // left mouse button 
java.awt.event.InputEvent.BUTTON2_MASK   // middle mouse button
java.awt.event.InputEvent.BUTTON3_MASK   // right mouse button

Keyboard control functions

Keyboard action is emulated by the following pair of functions. Their keycodes are defined in java.awt.event.KeyEvent:

void keyPress(int keycode)
void keyRelease(int keycode)

NOTE: Although java.awt.event.KeyEvent constants defines most of the US QWERTY keys, not all can actually be used with java.awt.Robot. Specifically, it appears that only the KeyEvent constants for unmodified keys can be used. See the following section for an example.

Utility functions

The robot can be put to sleep for a desired duration (in milliseconds). Also, the calling routine can be blocked until the robot exhausts its command queue.

void delay(int ms)
void waitForIdle()

Readers interested in Robot’s screen-capture capability are invited to take a look at Yair’s ScreenCapture utility on the File Exchange.

Using java.awt.Robot in Matlab

To create the Robot object in Matlab, simply run

robot = java.awt.Robot;

Moving the mouse cursor

With Matlab’s root (0) handle, the mouse cursor can be repositioned by

set(0,'PointerLocation',[x y]);

The mouse cursor is placed on the x-th pixel from left edge and the y-th pixel from the bottom edge of the screen.

Alternately, we could use the semi-documented moveptr function, which was described here last year.

The same operation can also be done using Robot as follows:

scrSize = get(0,'ScreenSize');
robot.mouseMove(x,scrSize(2)-y);

The extra step must be taken to convert from Matlab to Java screen coordinates.

Depending on the specific case (for example, whether or not we know the absolute or only relative screen coordinates), we may prefer using any of these equivalent mouse-movement alternatives.

Clicking mouse buttons

Unfortunately, we have few alternatives for automating mouse-clicks – Robot is basically our only option. Matlab recognizes 4 different mouse click types as specified in the Figure’s SelectionType property:

  • Normal: Click left mouse button
  • Extend: SHIFT-click left mouse button
  • Alternate: CTRL-click left mouse button
  • Open: Double click left mouse button

To observe the mouse click, open a figure and set its WindowButtonDownFcn callback:

myCallback = @(hObj,event) disp(get(hObj,'SelectionType'));
set(gcf,'WindowButtonDownFcn', myCallback);

To trigger the callback, the figure must have the focus and the mouse cursor must be on the figure. To ensure the callback invocation, “figure(gcf); drawnow;” commands are included in the code examples below. Make sure to place the mouse cursor on the figure before running these codes.

Here’s how the Robot can be used to perform each type of clicking. First, normal click:

figure(gcf); drawnow;
robot.mousePress  (java.awt.event.InputEvent.BUTTON1_MASK);
robot.mouseRelease(java.awt.event.InputEvent.BUTTON1_MASK);

For “open” or double click, repeat it twice:

figure(gcf); drawnow;
robot.mousePress  (java.awt.event.InputEvent.BUTTON1_MASK);
robot.mouseRelease(java.awt.event.InputEvent.BUTTON1_MASK);
robot.mousePress  (java.awt.event.InputEvent.BUTTON1_MASK);
robot.mouseRelease(java.awt.event.InputEvent.BUTTON1_MASK);

For the other two click types, we need to use the keyboard functions. First, “extend” or SHIFT-click:

figure(gcf); drawnow;
robot.keyPress    (java.awt.event.KeyEvent.VK_SHIFT);
robot.mousePress  (java.awt.event.InputEvent.BUTTON1_MASK);
robot.mouseRelease(java.awt.event.InputEvent.BUTTON1_MASK);
robot.keyRelease  (java.awt.event.KeyEvent.VK_SHIFT);

Lastly, “alternate” or CTRL-click:

figure(gcf); drawnow;
robot.keyPress    (java.awt.event.KeyEvent.VK_CONTROL);
robot.mousePress  (java.awt.event.InputEvent.BUTTON1_MASK);
robot.mouseRelease(java.awt.event.InputEvent.BUTTON1_MASK);
robot.keyRelease  (java.awt.event.KeyEvent.VK_CONTROL);

Clicking keyboard keys

Just as we have shown above how to press a modifier key (Ctrl or Alt key) to set the figure’s SelectionType property, keyPress and keyRelease functions can be used with character keys to type text. For example, with the focus on Matlab’s Command Prompt, running the following code executes the ver command:

robot.keyPress    (java.awt.event.KeyEvent.VK_V);
robot.keyRelease  (java.awt.event.KeyEvent.VK_V);
robot.keyPress    (java.awt.event.KeyEvent.VK_E);
robot.keyRelease  (java.awt.event.KeyEvent.VK_E);
robot.keyPress    (java.awt.event.KeyEvent.VK_R);
robot.keyRelease  (java.awt.event.KeyEvent.VK_R);
robot.keyPress    (java.awt.event.KeyEvent.VK_ENTER);
robot.keyRelease  (java.awt.event.KeyEvent.VK_ENTER);

In the previous section, I mentioned that not all KeyEvent constants are supported by java.awt.Robot, and keys must be defined with their unmodified characters. For example, a semicolon (‘;’) can be typed by:

robot.keyPress    (java.awt.event.KeyEvent.VK_SEMICOLON);
robot.keyRelease  (java.awt.event.KeyEvent.VK_SEMICOLON);

However, doing the same for a colon (‘:’ or SHIFT-’;') causes an error:

robot.keyPress    (java.awt.event.KeyEvent.VK_COLON);
robot.keyRelease  (java.awt.event.KeyEvent.VK_COLON);
??? Java exception occurred:
java.lang.IllegalArgumentException: Invalid key code
    at sun.awt.windows.WRobotPeer.keyPress(Native Method)
    at java.awt.Robot.keyPress(Unknown Source)

Instead of using the VK_COLON constant, VK_SEMICOLON constant must be used while SHIFT modifier key is pressed:

robot.keyPress    (java.awt.event.KeyEvent.VK_SHIFT);
robot.keyPress    (java.awt.event.KeyEvent.VK_SEMICOLON);
robot.keyRelease  (java.awt.event.KeyEvent.VK_SEMICOLON);
robot.keyRelease  (java.awt.event.KeyEvent.VK_SHIFT);

Although unconfirmed, I suspect VK_SEMICOLON constant would not work with keyboards in which semicolon is mapped to SHIFT-’,’ (e.g., Spanish or Italian keyboard layouts), while the VK_COLON constant would work with a French keyboard.

Putting it all together: jMouseEmu and inputEmu

To simplify the execution of the mouse and keyboard actions outlined above, I (Kesh Ikuma) have created the jMouseEmu and inputEmu utilities, which are available on the Matlab File Exchange. These interface/wrapper functions will be described in next week’s article.

Do you have any favorite use for Java Robots in your workflow? If so, please tell us all about it in a comment below.

 
Related posts:
  1. GUI automation utilities This article explains a couple of Matlab utilities that use Java's Robot class to programmatically control mouse and keyboard actions...
  2. ScreenCapture utility The ScreenCapture utility uses purely-documented Matlab for capturing a screen region as an image from within Matlab. ...
  3. Uicontrol callbacks This post details undocumented callbacks exposed by the underlying Java object of Matlab uicontrols, that can be used to modify the control's behavior in a multitude of different events...
  4. Detecting window focus events Matlab does not have any documented method to detect window focus events (gain/loss). This article describes an undocumented way to detect such events....
 

GUI automation utilities

$
0
0

Once again, I welcome guest writer Takeshi (Kesh) Ikuma. Last week, Kesh described how Java’s Robot class can be used to automate Matlab GUI. Today, Kesh will describe two Matlab utilities that help this automation process.

jMouseEmu and inputEmu are both available on the Matlab File Exchange. There is a large overlap between these utilities. As their name suggests, jMouseEmu is geared to control the mouse, while inputEmu emulates both mouse and keyboard inputs.

jMouseEmu

The jMouseEmu utility is an interface function to simplify the programmatic execution of mouse actions (movements, clicks and wheel scrolls). jmouseemu features include accepting relative position with regards to a specified Handle Graphics control, supporting the Shift and Control click modifier keys, supporting double clicking and mouse dragging, controlling mouse wheel turns and allowing multiple command execution with interval timing specification.

jmouseemu has two operating modes: single- or multi-command. In this respect, a single jmouseemu command consists of a cursor position and a click option – multiple such commands can be specified to jmouseemu in the multi-command mode.

In the single-command mode, the function takes the cursor position information and click options. The click options can be any of the possible SelectionType property strings, or “none” if no clicking is desired. For example,

jmouseemu([500,250],'normal');

places the mouse cursor at the coordinate (500, 250) with respect to the current figure (in Matlab coordinates) and then clicks the left mouse button. If no figure is currently open, the cursor is placed at (500,250) with respect to the bottom-left corner of the screen.

The reference graphics handle can be added as the first argument. For example, if hEdit is a uicontrol editbox handle, then

jmouseemu(hEdit,[],'open');
jmouseemu(hEdit,[],'normal');

provides a simple way to select the entire text in the edit box: the double-click jmouseemu call selects the first word, then the following single-click jmouseemu extends the selection to the entire text. If the position argument omitted, the cursor is placed on the upper-left hand corner of the object, unless hEdit=0, in which case the cursor stays at the current position.

To turn the mouse wheel 600 notches down (towards you), run:

jmouseemu(-600,'wheel');

Multi-command mode extends the single-command mode by accepting a cell array of commands along with the update interval T in seconds. The command array must have three columns, and its k-th row specifies the mouse command at time (k–1)T second.

Using the multi-command mode, the above example can be executed with a single jmouseemu call, placing the commands in a cell array:

jmouseemu({h,[],'open'; [],[],'normal'},0);  % T=0

Here, if you omit handles (i.e., the first column of command array) for the second or later commands, it defaults to the handle of the previous command.

Multi-command mode enables mouse cursor to follow a predefined path. For example, to make the mouse cursor travel in a full circle:

T = 0.01; % update every 10 milliseconds
x = pi * (0:T:2)';
pos = 100*[cos(x),sin(x)] + 250;
N = numel(x);
cmds = cell(N,3); % empty click option -> no click
cmds{1,1} = gcf; % position w.r.t. current figure
cmds(:,2) = mat2cell(pos,ones(N,1),2);
jmouseemu(cmds,T);

The command interval is realized by calling robot.delay(T*1e3) between commands. This example updates the mouse position every 10 msecs and completes the circle in 2 seconds.

In multi-command mode, there are two additional click options, “drag_on” and “drag_off”, available to enable mouse dragging. Dragging must be initiated and terminated within a single jmouseemu call, and “drag_off” and “none” are the only two acceptable click options during dragging.

Lastly, to pause mouse movement for a moment (longer than the update interval) , a “delay” command may be used:

jmouseemu({...; [],1.0,'delay'; ...}, T);  % pause for 1 second

Using jMouseEmu to trigger multiple Matlab HG callbacks

jmouseemu (or more broadly the Matlab handling of Java Robot commands) has a major drawback: If jmouseemu is used to trigger a Matlab GUI callback during a sequence of mouse maneuver, the callback will not be executed until the entire maneuver is completed. Moreover, since SelectionType property is not logged for every callback event, the incorrect SelectionType property may be reported during callback execution.

For example, add a double click at the beginning of the circular movement:

cmds{:,3} = 'open';
jmouseemu(cmds,T);

Running this code, you can observe the figure’s WindowsButtonDownFcn callback, which has been set to echo SelectionType property from earlier, does not kick in until the circle is completed. Now, introduce “extend” click at the end of the circle:

cmds{end,3} = 'extend';
jmouseemu(cmds,T);

Again, no callback displaying SelectionType echo occurs during the mouse movement. When the callbacks are finally executed, they return in the order – “normal”, “extend”, “open” – instead of expected “normal”, “open”, “extend”. To correct this behavior, jmouseemu must be called twice:

jmouseemu(cmds(1,:),T);
jmouseemu(cmds(2:end,:),T);

The key here is for each jmouseemu call to have only one callback triggering mouse click command and to place it at the end of the command sequence.

inputEmu

The inputEmu utility is similar to jMouseEmu, with extended support for keyboard inputs. The support for relative mouse cursor position with respect to an HG object, however, has been turned off in the current version of inputEmu (it may get turned on in a future version). Position information in inputEmu is always given in pixels with respect to the lower-left corner of the main display screen. Also, the user must note that the input arguments are flipped between jMouseEmu and inputEmu.

In addition to the left mouse click commands from jMouseEmu, inputEmu can emulate the right and middle mouse button clicks. For example, to perform the right click (e.g., to open a context menu):

inputemu({'right_down' []; 'right_up' []}'); % execute right button click

inputEmu’s main feature is keyboard support. There are 4 basic commands (the behavior may be somewhat different on non-windows platforms):

  • key_normal – Normal key press
  • key_ctrl - CONTROL + key press
  • key_alt – ALT + key press
  • key_win – WIN + key press

One other obvious key press, SHIFT + key press, is conspicuously missing from this list. This is because the SHIFT key is automatically pressed when a SHIFT modified character (e.g., an upper-case alphabet) is entered. For example, executing

inputemu('key_normal','Hello World'); % emulates typing "Hello World"

directly in Matlab prompt displays “Hello World” in the next command line. The text is first decoded to a sequence of key press and release pairs, including SHIFT key presses and releases as needed, then the sequence of key commands are sent to the java Robot object.

In addition to all the characters on the keyboard, non-character keys can be stroked by using escape characters:

  • ‘\SHIFT’
  • ‘\CTRL’
  • ‘\ALT’
  • ‘\WINDOWS’
  • ‘\BACKSPACE’
  • ‘\TAB’
  • ‘\ENTER’
  • ‘\ESC’
  • ‘\PAGEUP’
  • ‘\PAGEDOWN’
  • ‘\END’
  • ‘\HOME’
  • ‘\LEFT’
  • ‘\UP’
  • ‘\RIGHT’
  • ‘\DOWN’
  • ‘\INSERT’
  • ‘\DELETE’
  • ‘\CAPSLOCK’
  • ‘\NUMLOCK’
  • ‘\SCROLLLOCK’
  • ‘\PRINTSCREEN’
  • ‘\PAUSE’

Also, use ‘\\’ for the forward slash character and ‘\F1′ – ‘\F12′ for the Function keys. For example, to execute a Matlab “ver” command automatically via command window, run

inputemu('key_normal','ver\ENTER'); % runs the ver command

Lastly, as mentioned in the previous article, java.awt.Robot is sensitive to the keyboard locale, and the inputEmu utility is programmed specifically for the US QWERTY keyboard. To use the inputEmu for another keyboard layout, the program has to be modified accordingly. If anyone’s interested using this utility for different keyboard layout, I’d be glad to provide assistance.

Do you use Java’s Robot class or any of the utilities above in your work? Yair and I would love to hear about your experience in a short comment below.

 
Related posts:
  1. GUI automation using a Robot This article explains how Java's Robot class can be used to programmatically control mouse and keyboard actions...
  2. Borderless button used for plot properties A borderless button can be used to add unobtrusive functionality to plot axes...
  3. FindJObj – find a Matlab component’s underlying Java object The FindJObj utility can be used to access and display the internal components of Matlab controls and containers. This article explains its uses and inner mechanism....
  4. Matlab-Java interface using a static control The switchyard function design pattern can be very useful when setting Matlab callbacks to Java GUI controls. This article explains why and how....
 

Accessing plot brushed data

$
0
0

A few days ago, a reader of the Matlab Desktop blog asked whether it is possible to store plot brushed data in a separate variable for later processing. Data Brushing, first introduced in R2008a, enables interactive selection and marking of plot data points. The brushed data can then be stored in a variable using the context (right-click) menu, or the figure’s Tools/Brushing menu.

Saving brushed data to a variable

Saving brushed data to a variable

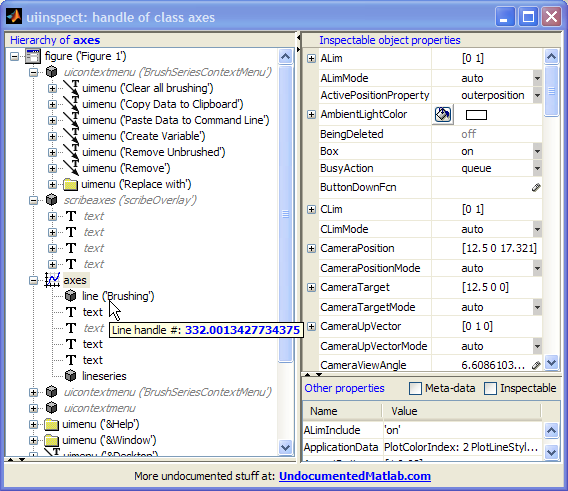
The said reader has specifically wanted programmatic access, rather than interactivity. The official answer is that data brushing was designed to be an interactive tool, and so this cannot be done. However, this has never stopped us before. So off I went to launch my favorite inspection tool, the UIInspect utility on the figure above (UIInspect will be described in a near-future article), which can be recreated with the following simple code:

t=0:0.2:25; plot(t,sin(t),'.-');
% Now brush some data points...
uiinspect(gca);

UIInspect-ion of a data-brushed plot

UIInspect-ion of a data-brushed plot (click for details)

A couple of alternative answers to the reader’s question were immediately apparent:

Directly accessing brushed data

First, we notice that data brushing added data-brushing context menus, both of which are called BrushSeriesContextMenu (the duplication is an internal Matlab bug, that does not affect usability as far as I can tell).

Also, an invisible scribe overlay axes has been added to hold the new annotations (data brushing is considered an annotation; scribe axes deserve a separate article, which they will indeed get someday).

More importantly for our needs, we see a new line item called ‘Brushing’, which displays the red lines and data points that we seek. We can now easily get the brushed data using this line’s XData and YData properties: non-brushed data points simply have NaN values:

UIInspect-ion of the data-brushing line

UIInspect-ion of the data-brushing line

hBrushLine = findall(gca,'tag','Brushing');
brushedData = get(hBrushLine, {'Xdata','Ydata'});
brushedIdx = ~isnan(brushedData{1});
brushedXData = brushedData{1}(brushedIdx);
brushedYData = brushedData{2}(brushedIdx);
% and similarly for ZData in 3D plots

Accessing brushing callbacks

Yet another way of approaching the problem is to use the available callback functions built-into the data-brushing functionality. We can access either the BrushSeriesContextMenu or the figure’s Tools/Brushing menu. I will leave the former (context-menu) approach as an exercise to the reader, and just describe the figure’s menu approach.

As I have already explained in a dedicated article, figure menu-bar actions are accessible via their handles, and we can retrieve that using a unique tag (well, most of the time – read that article for details). In our case, the Tools/Brushing/Create-new-variable menu item has the unique tag ‘figDataManagerNewVar’. So let’s use it:

>> hNewVarMenuItem = findall(gcf,'tag','figDataManagerNewVar')
hNewVarMenuItem =
          742.000244140625
 
>> hNewVarCallback = get(hNewVarMenuItem,'callback')
hNewVarCallback = 
    @datamanager.newvar
 
>> hNewVarCallback(gcf)   % activate the callback
% => set 'ans' as the new variable holding the brushed data
 
>> ans
ans =
                       6.4         0.116549204850494
                       6.6         0.311541363513379
                       6.8         0.494113351138609
                         7         0.656986598718789
                       7.2         0.793667863849153
                       7.4         0.898708095811627
                       7.6         0.967919672031486
                       7.8         0.998543345374605
                       ...         ...

Of course, we could also have gone the hard way, via the scribe axes and the annotations route. For masochistic people like me it could even be a worthwhile challenge. But for all other normal people, why bother when there are such simple alternatives, if we only knew how to find them. :-)

 
Related posts:
  1. Controlling plot data-tips Data-tips are an extremely useful plotting tool that can easily be controlled programmatically....
  2. Draggable plot data-tips Matlab's standard plot data-tips can be customized to enable dragging, without being limitted to be adjacent to their data-point. ...
  3. Performance: accessing handle properties Handle object property access (get/set) performance can be significantly improved using dot-notation. ...
  4. Accessing the Matlab Editor The Matlab Editor can be accessed programmatically, for a wide variety of possible uses - this article shows how....
 

uisplittool & uitogglesplittool

$
0
0

Matlab 7.6 (R2008a) and onward contain a reference to uisplittool and uitogglesplittool in the javacomponent.m and %matlabroot%/bin/registry/hg.xml files. These are reported as built-in functions by the which function, although they have no corresponding m-file as other similar built-in functions (note the double ‘t’, as in split-tool):

>> which uisplittool
built-in (C:\Matlab\R2010b\toolbox\matlab\uitools\uisplittool)

These uitools are entirely undocumented, even today (R2010b). They puzzled me for a very long time. An acute reader (Jeremy Raymonds) suggested they are related to toolbars, like other uitools such as the uipushtool and uitoggletool. This turned out to be the missing clue that unveiled these useful tools:

So what are uisplittool and uitogglesplittool?

Both uisplittool and uitogglesplittool are basic Handle-Graphics building blocks used in Matlab toolbars, similarly to the well-documented uipushtool and uitoggletool.

uisplittool presents a simple drop-down, whereas uitogglesplittool presents a drop-down that is also selectable.

The Publish and Run controls on the Matlab Editor’s toolbar are examples of uisplittool, and so are the Brush / Select-Data control on the figure toolbar, and the plot-selection drop-down on the Matlab Desktop’s Workspace toolbar:

uisplittool in action in the Matlab Desktop

uisplittool in action in the Matlab Desktop

Adding uisplittool and uitogglesplittool to a toolbar

Adding a uisplittool and uitogglesplittool to a toolbar is done in a similar manner to adding uipushtools and uitoggletools:

hToolbar = findall(gcf,'tag','FigureToolBar');
hUndo=uisplittool('parent',hToolbar);       % uisplittool
hRedo=uitogglesplittool('parent',hToolbar); % uitogglesplittool

Like uipushtool and uitoggletool, uisplittool and uitogglesplittool also have unique Type property values, ‘uisplittool’ and ‘uitogglesplittool’ respectively. The handles can also be tested using the built-in isa function:

>> isa(handle(hUndo),'uisplittool')   % or: 'uitogglesplittool'
ans =
     1
>> class(handle(hUndo))
ans =
uisplittool

Just as with uipushtools and uitoggletools, the new buttons have an empty button-face appearance, until we fix their CData, Tooltip and similar settable properties:

% Load the Redo icon
icon = fullfile(matlabroot,'/toolbox/matlab/icons/greenarrowicon.gif');
[cdata,map] = imread(icon);
 
% Convert white pixels into a transparent background
map(find(map(:,1)+map(:,2)+map(:,3)==3)) = NaN;
 
% Convert into 3D RGB-space
cdataRedo = ind2rgb(cdata,map);
cdataUndo = cdataRedo(:,[16:-1:1],:);
 
% Add the icon (and its mirror image = undo) to latest toolbar
set(hUndo, 'cdata',cdataUndo, 'tooltip','undo','Separator','on', ...
           'ClickedCallback','uiundo(gcbf,''execUndo'')');
set(hRedo, 'cdata',cdataRedo, 'tooltip','redo', ...
           'ClickedCallback','uiundo(gcbf,''execRedo'')');

User-created uisplittool & uitogglesplittool toolbar buttons

User-created uisplittool & uitogglesplittool toolbar buttons

Note that the controls can be created with these properties in a single command:

hUndo = uisplittool('parent',hToolbar, 'cdata',cdataRedo, ...);

Re-arranging the toolbar controls placement

Let us now re-arrange our toolbar buttons. Unfortunately, a bug causes uisplittools and uitogglesplittools to always be placed flush-left when the toolbar’s children are re-arranged (anyone at TMW reading this in time for the R2011a bug-parade selection?).

So, we can’t re-arrange the buttons at the HG-children level. Luckily, we can re-arrange directly at the Java level (note that until now, the entire discussion of uisplittool and uitogglesplittool was purely Matlab-based):

jToolbar = get(get(hToolbar,'JavaContainer'),'ComponentPeer');
jButtons = jToolbar.getComponents;
for buttonId = length(jButtons)-3 : -1 : 7  % end-to-front
   jToolbar.setComponentZOrder(jButtons(buttonId), buttonId+1);
end
jToolbar.setComponentZOrder(jButtons(end-2), 5);   % Separator
jToolbar.setComponentZOrder(jButtons(end-1), 6);   % Undo
jToolbar.setComponentZOrder(jButtons(end), 7);     % Redo
jToolbar.revalidate;

Re-arranged uisplittool & uitogglesplittool toolbar buttons

Re-arranged uisplittool & uitogglesplittool toolbar buttons
(not as simple as it may sound)

Next week, I will combine the information in this article, with last year’s articles about uiundo, and show how we can create a dynamic figure toolbar drop-down of undo/redo events. Here is a preview to whet your appetite:

undo/redo buttons implemented using uisplittool

undo/redo buttons implemented using uisplittool

 
Related posts:
  1. uisplittool & uitogglesplittool callbacks Matlab's undocumented uisplittool and uitogglesplittool are powerful toolbar controls - this article explains how to customize their behavior...
  2. Figure toolbar components Matlab's toolbars can be customized using a combination of undocumented Matlab and Java hacks. This article describes how to access existing toolbar icons and how to add non-button toolbar components....
  3. uiundo – Matlab’s undocumented undo/redo manager The built-in uiundo function provides easy yet undocumented access to Matlab's powerful undo/redo functionality. This article explains its usage....
  4. Customizing uiundo This article describes how Matlab's undocumented uiundo undo/redo manager can be customized...
 

uisplittool & uitogglesplittool callbacks

$
0
0

Last week, I presented the undocumented uisplittool and uitogglesplittool functions and showed how they can be added to a Matlab figure toolbar. Today I wish to conclude this topic by explaining how these controls can be customized with user-defined callbacks and pop-up menus.

Callback functionality

Both uisplittool and uitogglesplittool have a Callback property, in addition to the standard ClickedCallback property that is available in uipushtools and uitoggletools.

The standard ClickedCallback is invoked when the main button is clicked, while Callback is invoked when the narrow arrow button is clicked. uitogglesplittool, like uitoggletool, also has settable OnCallback and OffCallback callback properties.

The accepted convention is that ClickedCallback should invoke the default control action (in our case, an Undo/Redo of the topmost uiundo action stack), while Callback should display a drop-down of selectable actions.

While this can be done programmatically using the Callback property, this functionality is already pre-built into uisplittool and uitogglesplittool for our benefit. To access it, we need to get the control’s underlying Java component.

Accessing the underlying Java component is normally done using the findjobj utility, but in this case we have a shortcut: the control handle’s hidden JavaContainer property that holds the underlying com.mathworks.hg.peer.SplitButtonPeer (or .ToggleSplitButtonPeer) Java reference handle. This Java object’s MenuComponent property returns a reference to the control’s drop-down sub-component (which is a com.mathworks.mwswing.MJPopupMenu object):

>> jUndo = get(hUndo,'JavaContainer')
jUndo =
com.mathworks.hg.peer.SplitButtonPeer@f09ad5
 
>> jMenu = get(jUndo,'MenuComponent')  % or: =jUndo.getMenuComponent
jMenu =
com.mathworks.mwswing.MJPopupMenu[Dropdown Picker ButtonMenu,...]

Let’s add a few simple textual options:

jOption1 = jMenu.add('Option #1');
jOption1 = jMenu.add('Option #2');
set(jOption1, 'ActionPerformedCallback', 'disp(''option #1'')');
set(jOption2, 'ActionPerformedCallback', {@myCallbackFcn, extraData});

setting uisplittool & uitogglesplittool popup-menus

setting uisplittool & uitogglesplittool popup-menus

Popup-menus are described in more detail elsewhere (and in future articles). In the past I have already explained how icons and HTML markup can be added to menu items. Sub-menus can also be added.

A complete example

Let’s now use this information, together with last year’s set of articles about Matlab’s undocumented uiundo functionality, to generate a complete and more realistic example, of undo/redo toolbar buttons.

Undo and redo are actions that are particularly suited for uisplittool, since its main button enables us to easily undo/redo the latest action (like a simple toolbar button, by clicking the main uisplittool button) as well as select items from the actions drop-down (like a combo-box, by clicking the attached arrow button) – all this using a single component.

% Display our GUI
hEditbox = uicontrol('style','edit', 'position',[20,60,40,40]); 
set(hEditbox, 'Enable','off', 'string','0');
hSlider = uicontrol('style','slider','userdata',hEditbox);
set(hSlider,'Callback',@test_uiundo);  
 
% Display the figure toolbar that was hidden by the uicontrol function
set(gcf,'Toolbar','figure');
 
% Add the Undo/Redo buttons
hToolbar = findall(gcf,'tag','FigureToolBar');
hUndo = uisplittool('parent',hToolbar);
hRedo = uitogglesplittool('parent',hToolbar);
 
% Load the Redo icon
icon = fullfile(matlabroot,'/toolbox/matlab/icons/greenarrowicon.gif');
[cdata,map] = imread(icon);
 
% Convert white pixels into a transparent background
map(find(map(:,1)+map(:,2)+map(:,3)==3)) = NaN;
 
% Convert into 3D RGB-space
cdataRedo = ind2rgb(cdata,map);
cdataUndo = cdataRedo(:,[16:-1:1],:);
 
% Add the icon (and its mirror image = undo) to latest toolbar
set(hUndo, 'cdata',cdataUndo, 'tooltip','undo','Separator','on', ...
           'ClickedCallback','uiundo(gcbf,''execUndo'')');
set(hRedo, 'cdata',cdataRedo, 'tooltip','redo', ...
           'ClickedCallback','uiundo(gcbf,''execRedo'')');
 
% Re-arrange the Undo/Redo buttons  
jToolbar = get(get(hToolbar,'JavaContainer'),'ComponentPeer');
jButtons = jToolbar.getComponents;
for buttonIdx = length(jButtons)-3 : -1 : 7  % end-to-front
   jToolbar.setComponentZOrder(jButtons(buttonIdx), buttonIdx+1);
end
jToolbar.setComponentZOrder(jButtons(end-2), 5);    % Separator
jToolbar.setComponentZOrder(jButtons(end-1), 6);    % Undo
jToolbar.setComponentZOrder(jButtons(end), 7);      % Redo
jToolbar.revalidate;
 
% Retrieve redo/undo object
undoObj = getappdata(gcf,'uitools_FigureToolManager');
if isempty(undoObj)
   undoObj = uitools.FigureToolManager(gcf);
   setappdata(gcf,'uitools_FigureToolManager',undoObj);
end
 
% Populate Undo actions drop-down list
jUndo = get(hUndo,'JavaContainer');
jMenu = get(jUndo,'MenuComponent');
undoActions = get(undoObj.CommandManager.UndoStack,'Name');
jMenu.removeAll;
for actionIdx = length(undoActions) : -1 : 1    % end-to-front
    jActionItem = jMenu.add(undoActions(actionIdx));
    set(jActionItem, 'ActionPerformedCallback', @myUndoCallbackFcn);
end
jToolbar.revalidate;
 
% Drop-down callback function
function myUndoCallbackFcn(jActionItem,hEvent)
    % user processing needs to be placed here
end  % myUndoCallbackFcn

undo/redo buttons implemented using uisplittool

undo/redo buttons implemented using uisplittool

In a real-world application, the code-segment above that populated the drop-down list would be placed within the slider’s test_uiundo() callback function, and we would set a similar drop-down for the hRedu button. In addition, we would dynamically modify the button tooltips. As a final customization, we could modify the figure’s main menu. Menu customization will be discussed in a future separate set of articles.

Have you used uisplittool or uitogglesplittool in your GUI? If so, please tell us what use you have made of them, in a comment below.

 
Related posts:
  1. uisplittool & uitogglesplittool Matlab's undocumented uisplittool and uitogglesplittool are powerful controls that can easily be added to Matlab toolbars - this article explains how...
  2. Matlab callbacks for Java events Events raised in Java code can be caught and handled in Matlab callback functions - this article explains how...
  3. Uicontrol callbacks This post details undocumented callbacks exposed by the underlying Java object of Matlab uicontrols, that can be used to modify the control's behavior in a multitude of different events...
  4. Figure toolbar components Matlab's toolbars can be customized using a combination of undocumented Matlab and Java hacks. This article describes how to access existing toolbar icons and how to add non-button toolbar components....
 

FIG files format

$
0
0

A short while ago, a StackOverflow user asked how to extract data from FIG files in Matlab. The answer to this question is easy, but I wish to use the opportunity to show how this can be useful in Matlab applications.

The need: load a FIG without displaying it

In data-processing applications, we often present data in graphs that can then be manipulated and saved for later use. In Matlab, saving is done interactively (via the figure’s File/Save menu option or via the figure’s Save toolbar button), or programmatically (via the hgsave function). In all cases, the data is stored in a *.FIG file (the FIG extension can actually be changed, but I really don’t see why).

The point is that in order to re-load the stored data, we need to use hgload, which has a nasty side-effect of actually displaying the stored figure.

This is bad in terms of performance and memory, especially for heavily-laden GUI figures, not to mention the fact that sometimes we do not want to display the GUI at all. We often just need to extract a sub-set of the stored information (for example, the plot values), without having to display the figure.

The answer: FIGs are simply MATs in disguise

Here’s where the undocumented stuff enters:

It seems that a FIG file is simply a hierarchical structure of all the non-default properties of the stored figure and its descendant handles, all this stored within a simple MAT file.

This is hinted in several places, for example in hgsave‘s doc page, and in the MAT-file preferences panel:

MAT-file preferences (note the FIG clarification)

MAT-file preferences (note the FIG clarification)

Knowing this, we can easily load the data, without displaying the figure, by using load(filename,’-mat’) rather than hgload. For example:

% Create and store a simple plot figure
>> figure('Name','Test #1');
>> plot(1:9, sqrt(1:9));
>> hgsave(gcf,'testFig');
 
% Load the figure data
>> d = load('testFig.fig','-mat')
d = 
    hgS_070000: [1x1 struct]   % a Matlab 7 figure
 
% Investigate the figure data
>> d.hgS_070000
ans = 
          type: 'figure'
        handle: 1
    properties: [1x1 struct]
      children: [1x1 struct]
       special: []
 
>> d.hgS_070000.children
ans = 
          type: 'axes'
        handle: 176.08251953125
    properties: [1x1 struct]
      children: [1x1 struct]
       special: [4x1 double]
 
>> d.hgS_070000.children.children
ans = 
          type: 'graph2d.lineseries'
        handle: 177.0830078125
    properties: [1x1 struct]
      children: []
       special: []
 
>> d.hgS_070000.children.children.properties
ans = 
              Color: [0 0 1]
              XData: [1 2 3 4 5 6 7 8 9]
              YData: [1 1.4142 1.7321 2 2.2361 2.4495 2.6458 2.8284 3]
    ApplicationData: [1x1 struct]
        XDataJitter: 0
          XDataMode: 'manual'
      ObeyXDataMode: 'auto'
                ...
 
% Extract plot data
>> YData = d.hgS_070000.children.children.properties.YData
YData =
  1.0000  1.4142  1.7321  2.0000  2.2361  2.4495  2.6458  2.8284  3.0000

We see a couple of interesting things in this simple example:

First, note that the top-level structure node is called “hgS_070000″ – we’ll dig into this next week. Basically, it indicates that the structure holds a Matlab 7 figure.

Secondly, we see hidden/undocumented properties of the stored objects (for example, the lineseries’ XDataJitter and ObeyXDataMode properties). ApplicationData is such a hidden handle, which is widely used as a substitute for any handle’s UserData property (the built-in setappdata and getappdata functions are simply wrappers for accessing this property using standard set and get functions).

Have you used the FIG/MAT feature for any useful functionality? If so, please do share your experience in a comment.

Next week, I will explain how looking under hgsave‘s hood leads to useful functions and to an interesting insight about Matlab’s future. Merry Christmas everybody!

 
Related posts:
  1. Setting axes tick labels format Matlab plot axes ticks can be customized in a way that will automatically update whenever the tick values change. ...
  2. Reading non-Latin text files A workaround that enables reading non-Latin text files in Matlab is shown...
  3. Plot LimInclude properties The plot objects' XLimInclude, YLimInclude, ZLimInclude, ALimInclude and CLimInclude properties are an important feature, that has both functional and performance implications....
  4. Handle Graphics Behavior HG behaviors are an important aspect of Matlab graphics that enable custom control of handle functionality. ...
 

Enable/disable entire figure window

$
0
0

Some time ago, a reader on the CSSM newsgroup asked whether it is possible to disable an entire figure window while some processing is taking place. Last week, Mike posted an article about the built-in functions uiwait and uiresume on MathWork’s Matlab Desktop blog, which more-or-less answers this need. Today I will expand the answer based on several undocumented/unsupported mechanisms.

Uiwait and uiresume

We start with a short review of the supported mechanism: We can use the built-in uiwait function to suspend Matlab processing until either the specified handle (typically a figure handle) is deleted/closed, a user callback programmatically calls uiresume, or Ctrl-C is pressed. A short example, adapted from uiwait‘s help section (the official help section has a bug, so if anyone reads this at TMW, please fix):

h = uicontrol('Position', [20 20 200 40], 'String', 'Continue', 'Callback', 'uiresume(gcbf)');
f = gcf;
disp('This will print immediately');
uiwait(f); 
disp('This will print after you click Continue or close the window');
 
% Close the figure (use try-catch in case f is already closed)
try close(f); catch, end

Unfortunately, the side effect is that uiwait blocks the regular (non-callback’ed) processing until the lock is released. This is great for simple cases where we require a user to respond to a popup window (e.g., message-box or input dialog) before being allowed to proceed. In more complex situations we may wish to suspend interaction on certain figure windows while continuing to process Matlab functionality – this is impossible to do using uiwait.

Matlab does not have any documented way to disable an entire figure window. You can set the figure’s WindowStyle property to ‘modal’ but this is not the same: (1) it removes the toolbar and menu-bar (2) it still enables interaction with all the figure’s GUI controls and (3) it prevents access to any other Matlab window or desktop until the modal figure is closed. This is certainly NOT what we need.

Of course, we could always loop over all the relevant GUI handles and set their Enable property to ‘inactive’ or ‘off’. But this is tedious, lengthy, and in complex GUIs that have multiple layers of nested panels, it also requires careful recursive programming. We also need to take care to disable hidden handles, toolbars, menu-bars, context-menus, Java components – all these have different ways of being accessed and disabled. And once we uiresume from the lock, we need to remember each handle’s pre-uiwait state, so that if it was disabled before the call to uiwait, it will remain so after uiresume. In short, this is not a trivial exercise at all.

Uisuspend and uirestore

To complicate things, the fully-documented and supported uiwait and uiresume functions have the semi-documented unsupported built-in counterparts uisuspend and uirestore, which are very similar in functionality and name. It is important not to confuse between these two function sets, and most importantly, not to confuse between uiresume and uirestore after using their counterparts earlier in the code – odd things might happen if you do…

Hopefully, in a nearby Matlab release these inconsistencies between the two function sets will disappear and they will be merged, because the current situation is prone to errors and confusion. For backward compatibility considerations, I hope that uisuspend and uirestore would not be discontinued but rather be modified to simply call uiwait and uiresume.

Note that in Matlab releases up to R2010b, uirestore had a minor bug in that it overwrites the figure’s WindowScrollWheelFcn callback with the WindowKeyPressFcn value. This bug was finally fixed in R2011a.

How to enable/disable a figure window

So going back to the main question, we want to find a way to disable an entire figure window, in one simple stroke, and without blocking the Matlab processing.

As usual, we turn to Java and the solution is trivially simple:

First, get the figure window’s underlying Java reference. Note that we need the top-level container reference, rather than the proxy peer handle returned by the JavaFrame hidden property:

>> jFigPeer = get(handle(gcf),'JavaFrame')
jFigPeer =
com.mathworks.hg.peer.FigurePeer@1ffbad6
 
>> jWindow = jFigPeer.fFigureClient.getWindow
ans =
com.mathworks.hg.peer.FigureFrameProxy$FigureFrame[...]

Now remember that all Java GUI components (on which Matlab GUI is based) contain an Enabled property. So, simply set this property on the jWindow reference to true or false:

jWindow.setEnabled(false);  % or true
 
% an equivalent alternative
set(handle(jWindow),'Enabled',false)  % or true

By the way, if you only need to disable the figure’s content area (i.e., not the toolbar and menu bar), simply use a different reference handle:

jFigPeer.getFigurePanelContainer.setEnabled(false);  % or true

Notes:

  • While the window looks the same when it is disabled, in reality none of its GUI elements can be clicked or activated (try it!). If you also want the figure to appear blurred you could try using something like a JXLayer semi-translucent glass pane.
  • The Java components’ property is called Enabled, not Enable as in pure-Matlab Handle-Graphics controls. Also, the Java property expects true/false (or 0/1), rather than Matlab’s ‘on’/'off’ (there are some fine details here that are release-specific so I will skip them)
  • For docked windows the top-level window is the figure’s group container window or the desktop window, which we do not want to disable. Detecting this is easy (check whether the figure’s WindowStyle is ‘docked’), and in such cases simply disable/enable the figure’s content area as shown above.

Use of the JavaFrame property

Note that all this relies on the undocumented hidden figure property JavaFrame, which issues a standing warning (since Matlab release R2008a) of becoming obsolete in some future Matlab release (HG2?):

>> jFigPeer = get(gcf,'JavaFrame')
Warning: figure JavaFrame property will be obsoleted in a future release.
For more information see the JavaFrame resource on the MathWorks web site.
(Type "warning off MATLAB:HandleGraphics:ObsoletedProperty:JavaFrame"
to suppress this warning.) 

jFigPeer =
com.mathworks.hg.peer.FigurePeer@1ffbad6

To remove the above warning I have used (note the handle wrapper, as suggested by Donn Shull):

jFigPeer = get(handle(gcf),'JavaFrame')

If and when JavaFrame does become obsolete in some future Matlab version, be sure to look in this blog for workarounds.

You may also wish to inform MathWorks on the dedicated webpage that they have set up for specifically this reason (http://www.mathworks.com/javaframe), how you are using JavaFrame and why it is important for you. This may help them to decide whether to keep JavaFrame or possibly add the functionality using other means.

The enableDisableFig utility

In 2007, I created the enableDisableFig utility that wraps the above code in an easy-to-use Matlab utility that I have uploaded to the File Exchange.

enableDisableFig returns the current state of the specified figure handle (or gcf if no handle is specified), and optionally sets the figure’s enabled/disabled state to a new value (‘on’,'off’, true or false):

>> oldState = enableDisableFig(gcf, 'on')
oldState =
on
 
>> enableDisableFig(oldState);
>> enableDisableFig(true);  % an alternative

enableDisableFig also provides some sanity checks and error handling that should always appear in any real-world application. In this blog I generally tend to provide only bare-bones code snippets (as above). But in any respected application we must check the validity of input arguments and return values, catch run-time errors, compensate for incompatibilities with older Matlab release and so on. Take a look at enableDisableFig‘s source code to see how I have done this.

Visual aid

When any GUI control is disabled, the accepted convention is to shade it in a gray color as a visual aid to the user that the control is currently disabled. This is automatically done by Matlab when any control’s Enable property is set to ‘off’. In our case, it would be very helpful to display a similar blurring effect for the disabled figure window.

Would you be very surprised if I told you that this is impossible to do with regular Matlab, but trivially easy to achieve using a tiny bit of Java magic powder? I’ll expand on this in my next post, but here’s something to keep you waiting:

A blurred disabled figure

A blurred disabled figure

Server upgrade

This weekend (9-10 April, 2011) I plan to upgrade the website. This will entail moving to a different webserver, database, upgraded blogging application, new design etc. This site may be down or “goofy” for quite a few hours. Hopefully all will be back to normal by Monday and I hope you will like the new design.

 
Related posts:
  1. Minimize/maximize figure window Matlab figure windows can easily be maximized, minimized and restored using a bit of undocumented magic powder...
  2. Transparent Matlab figure window Matlab figure windows can be made fully or partially transparent/translucent or blurred - this article explains how...
  3. Blurred Matlab figure window Matlab figure windows can be blurred using a semi-transparent overlaid window - this article explains how...
  4. Detecting window focus events Matlab does not have any documented method to detect window focus events (gain/loss). This article describes an undocumented way to detect such events....
 

Transparent Matlab figure window

$
0
0

Every now and then, a user asks whether it is possible to make an entire Matlab window transparent (example). This could be used, for example, for window fade-in/fade-out effects. The short answer is that there is no supported way of doing this with pure documented Matlab, but it is trivially easy to achieve using just a bit of Java magic powder (surprise, surprise).

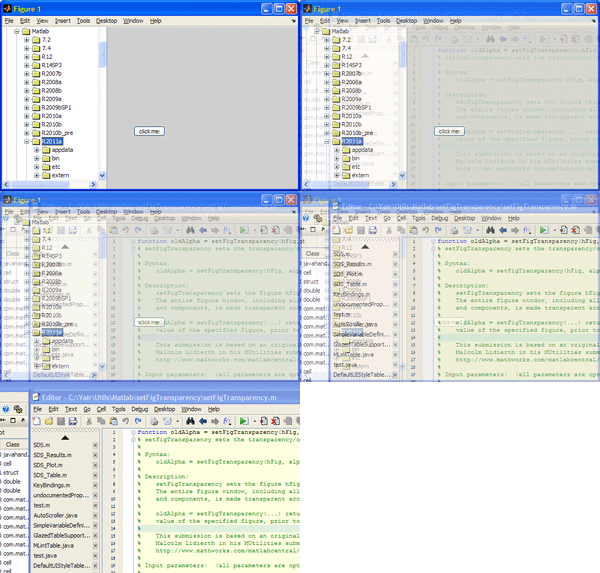
Matlab figure window transparency

Following an idea I got from Malcolm Lidierth’s MUtilities submission on the Matlab File Exchange, the solution for setting Matlab figure window transparency is quite simple: Get the figure’s underlying Java window reference handle, as in last week’s article. Then use Java’s setWindowOpacity method to set the window’s transparency value. Actually, setWindowOpacity sets the opacity level, rather than transparency, but they are obviously complementary and I personally find “transparency” to be more easily understandable.

By default, windows are created with an opacity of 1.0 (= not transparent). They can be set to any floating-point value between 0.0-1.0, where an opacity of 0.0 means full transparency, and any value in between means partial transparency (i.e., translucency):

jFigPeer = get(handle(gcf),'JavaFrame');
jWindow = jFigPeer.fFigureClient.getWindow;
com.sun.awt.AWTUtilities.setWindowOpacity(jWindow,0.7)

Semi-transparent (translucent) Matlab figure (click to enlarge)

Semi-transparent (translucent) Matlab figure (click to enlarge)

Similarly, you can set the entire Matlab Desktop’s transparency/opacity value:

jDesktop = com.mathworks.mde.desk.MLDesktop.getInstance.getMainFrame;
com.sun.awt.AWTUtilities.setWindowOpacity(jDesktop, 0.8);

Note that the com.sun.awt.AWTUtilities class also enables other GUI effects that would make a Matlab GUI developer’s mouth to start drooling: shaped windows, per-pixel transparency values, mirroring/reflection, window shadows, gradients etc. Perhaps I’ll explore their adaptation for Matlab figures someday.

Fade-in / fade-out

Window fade-in/fade-out effects can easily be achieved using transparency: Simply invoke the setWindowOpacity method several times, with progressively higher or lower values. This is easily done in a simple blocking loop. For example, to fade-out a window:

for stepIdx = 1 : 5
   newAlpha = 1.0 - 0.2*stepIdx;
   com.sun.awt.AWTUtilities.setWindowOpacity(jWindow,newAlpha);
   jWindow.repaint;
   pause(0.2);  % seconds
end

Gradual window fade-out

Gradual window fade-out

A more general example dynamically computes the opacity step size/duration and also enables non-blocking fade effects using an asynchronous timer:

% Compute the required opacity-setting steps
fadeDuration = 1.5;  % seconds
oldAlpha = com.sun.awt.AWTUtilities.getWindowOpacity(jWindow);
newAlpha = 0.0;
deltaAlpha = newAlpha - oldAlpha;
maxStepAlpha = 0.03;
steps = fix(abs(deltaAlpha) / maxStepAlpha) + 1;
stepAlpha = deltaAlpha / steps;
stepDuration = fadeDuration / (steps-1);
 
% If blocking, do the fade effect immediately
if blockingFlag || steps==1
   for stepIdx = 1 : steps
      newAlpha = oldAlpha + stepAlpha*stepIdx;
      com.sun.awt.AWTUtilities.setWindowOpacity(jWindow,newAlpha);
      jWindow.repaint;
      if stepIdx < steps,  pause(stepDuration);  end
   end
else
   % non-blocking: fade in/out asynchronously using a dedicated timer
   start(timer('ExecutionMode','fixedRate', 'Period',0.1, 'TasksToExecute',steps, ...
               'TimerFcn', {@timerFcn,jWindow,oldAlpha,stepAlpha}));
end
 
% Timer function for non-blocking fade-in/fade-out effect
function timerFcn(hTimer,eventData,jFrame,currentAlpha,stepAlpha)  %#ok<INUSL> eventData
  stepIdx = hTimer.TasksExecuted;
  newAlpha = currentAlpha + stepAlpha*stepIdx;
  com.sun.awt.AWTUtilities.setWindowOpacity(jFrame,newAlpha);
  jFrame.repaint;
  if stepIdx == hTimer.TasksToExecute
      stop(hTimer);
      delete(hTimer);
  end
end  % timerFcn

Of course, you can also fade-in/out to intermediate values such as 0.3 or 0.8. If you fade-out completely (i.e., to a value of 0.0), it might be a good idea to actually close the figure window once it gets the totally-transparent value of 0.0.

I’ve prepared a Matlab utility that contains all these options, including optional blocking/non-blocking fade effects, in my setFigTransparency utility, which is available for download on the Matlab File Exchange. You may also wish to use Malcolm Lidierth’s MUtilities, which also has similar functionalities (plus some other goodies).

Limitations

Setting a figure window’s transparency requires using Java Run-time Engine (JRE) 1.6.0_10 (also called “Java 6 update 10″) or higher. This means that it’s supported on Matlab release 7.9 (R2009b) and higher by default, and on earlier releases using a JRE retrofit.

If you are using an earlier Matlab release, consider a retrofit of JRE 1.6.0_10 or any later version (e.g., the latest available version today is 1.6 update 24). The JRE can be downloaded from here, and you can configure Matlab to use it according to the instructions here. As noted, Matlab R2009b (7.9) and onward, at least on Microsoft Windows, pre-bundle a JRE version that does support transparency/opacity and so do not require a retrofit.

You can check your current Java version in Matlab as follows:

>> version -java
ans =
Java 1.6.0_17-b04 with Sun Microsystems Inc. Java HotSpot(TM) Client VM mixed mode

Unfortunately, Matlab plot axes cannot be made transparent. If you have any axes in your GUI, the axes area will simply appear as a shaded axes, whose intensity depends on the selected alpha (transparency) value; the contents beneath the window will not be merged in the axes area as it is in the non-axes areas.

Finally, note that com.sun.awt.AWTUtilities is itself an undocumented Java class. It is bundled with the standard Java release since 2008 (1.6.0_10), and yet is not part of the official release because its API has not yet settled. In fact, in the upcoming Java 7 release, which is expected in a few months, and which I expect to be available in Matlab sometime in 2012, the set of transparency/opacity methods have migrated to the fully-documented java.awt.Window class.

Blurred figure window

So here’s a riddle for you: using figure window transparency, can you guess how to make a Matlab figure appear blurred for disabled figures (see the screenshot there)? There are several possible ways to do this – can you find the simplest? The first one to post a comment with a correct answer gets a smiley… My answer will appear in next week’s article.

Upgraded website

Also, did you notice my new website design? It’s supposed to be much more readable (yes – also on Android…). It now also runs on a multi-server cloud, which means more stability and faster response times. Do you like the new design? hate it? I would love to hear your feedback via comment or email.

 
Related posts:
  1. Blurred Matlab figure window Matlab figure windows can be blurred using a semi-transparent overlaid window - this article explains how...
  2. Minimize/maximize figure window Matlab figure windows can easily be maximized, minimized and restored using a bit of undocumented magic powder...
  3. Enable/disable entire figure window Disabling/enabling an entire figure window is impossible with pure Matlab, but is very simple using the underlying Java. This article explains how....
  4. Detecting window focus events Matlab does not have any documented method to detect window focus events (gain/loss). This article describes an undocumented way to detect such events....
 

Blurred Matlab figure window

$
0
0

Following my post two weeks ago about disabling an entire Matlab figure window, and my article last week about setting the transparency of a figure window, I would like to combine these two functionalities into a blurred-window effect for a disabled window.

The basic idea

The basic idea, as reader Mory pointed out in a comment, is to overlay a semi-transparent empty figure window, having just the right size and position, on top of the main (disabled) figure window:

Main (unblurred) window + Semi-transparent window = Blurred window effect

Main (unblurred) window + semi-transparent window = blurred window effect

In addition to ensuring the correct figure size and position, there are several other things we should care for: We need to synchronize the figure/blurring color, menubar/toolbar, and title. We also need to handle docking, resizing and figure movement. Finally we need to connect the two figures so that whenever one is closed then so is the other.

blurFigure

My blurFigure utility on the Matlab File Exchange attempts to handle all these setups for the user. The utility is quite simple to use:

blurFigure(hFig) blurs figure hFig and prevents interaction with it. The only interaction possible is with user-created controls on the blurring panel (see below).

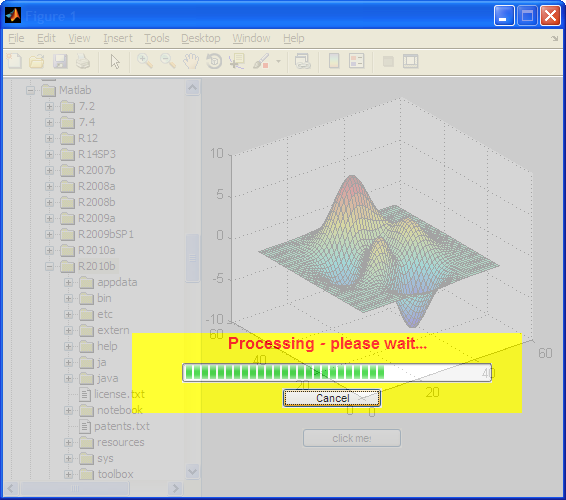
hFigBlur = blurFigure(hFig) returns the overlaid blurred figure pane. This is useful to present a progress bar or other GUI controls, for user interaction during the blur phase (see the demo below).

blurFigure(hFig,STATE) sets the blur status of figure hFig to STATE, where state is ‘on’,'off’,true or false (default=’on’/true). blurFigure(hFig,’on’) or blurFigure(hFig,true) is the same as: blurFigure(hFig); blurFigure(hFig,’off’) or blurFigure(hFig,false) is the same as: close(hFigBlur).

blurFigure(‘demo’) displays a simple demo of the blurring. In fact, this runs the following simple code:

% Create the main (blurred) figure window
hFigMain = figure;
 
% Display some GUI controls in the main window
try oldWarn = warning('off','MATLAB:uitree:MigratingFunction'); catch, end
hTree = uitree('root','c:\');
drawnow;
try hTree.getTree.expandRow(0); catch, end
try warning(oldWarn); catch, end
uicontrol('string','click me!', 'units','pixel', 'pos',[300,50,100,20]);
axes('parent',gcf, 'units','pixel', 'pos',[230,100,300,300]);
surf(peaks);
set(gcf,'ToolBar','figure');  % restore the toolbar that was removed by the uicontrol() call above
 
% Call blurFigure() to add a semi-transparent overlaid window
hFigBlurTemp = blurFigure(hFigMain);
 
% Add some non-blurred controls on top of the blur
uicontrol('parent',hFigBlurTemp, 'style','text', 'units','pixel', 'pos',[130,85,390,80], ...
          'string','Processing - please wait...', 'FontSize',12, 'FontWeight','bold','Fore','red','Back','yellow');
jProgressBar = javacomponent('javax.swing.JProgressBar', [180,115,310,20], hFigBlurTemp);
jProgressBar.setValue(67);
uicontrol('parent',hFigBlurTemp, 'string','Cancel', 'pos',[280,90,100,20], 'Callback','close(gcbf)');

Non-blurred controls displayed over a blurred figure window

Non-blurred controls displayed over a blurred figure window

Do you have some other interesting uses for window transparency in Matlab? If so, please share your thought in a comment.

 
Related posts:
  1. Transparent Matlab figure window Matlab figure windows can be made fully or partially transparent/translucent or blurred - this article explains how...
  2. Enable/disable entire figure window Disabling/enabling an entire figure window is impossible with pure Matlab, but is very simple using the underlying Java. This article explains how....
  3. Minimize/maximize figure window Matlab figure windows can easily be maximized, minimized and restored using a bit of undocumented magic powder...
  4. Customizing figure toolbar background Setting the figure toolbar's background color can easily be done using just a tiny bit of Java magic powder. This article explains how. ...
 

Minimize/maximize figure window

$
0
0

Over the past couple of years, I posted several articles using the JavaFrame property of the figure handle, which enables access to the GUI’s underlying Java peer object. Today, I show how using JavaFrame we can solve a very frequent user request on the Matlab CSSM forum.

The problem

Matlab figures can be maximized, minimized and restored by interactively clicking the corresponding icon (or menu item) on the figure window’s frame (the title bar). However, we often need to create maximized main-application windows, and wish to save the users the need to manually maximize the window. Moreover, we may sometimes even wish to prevent users from resizing a maximized main window.

Unfortunately, Matlab does not contain any documented or supported way to programmatically maximize, minimize or restore a figure window.

This is very strange considering the fact that these are such elementary figure operations. Moreover, these operations are supported internally (and have been for many releases already), as shown below. It is therefore difficult for me to understand why they were not added to the documented Matlab HG wrapper functionality a long time ago. I fail to understand why obscure features such as docking were added to the wrapper, but standard minimization and maximization were not.

Maximization

Several solutions have been presented to this problem over the years. Let us start with the pressing question of figure maximization:

Solutions that rely on documented Matlab features tend to compute the available screen size and resize the figure accordingly. The result is lacking in many respects: it does not account for the taskbar (neither in size nor in location, which is not necessarily at the bottom of the screen); it does not remove the window border as in regular maximized figures; and it often ignores extended desktops (i.e. an attached additional monitor).

The solutions that do work properly all rely on undocumented features: Some use platform-specific native Windows API in a mex-file (Jan Simon’s recent WindowAPI submission really pushes the limit in this and other regards). Alternately, we can easily use the platform-independent JavaFrame:

>> jFrame = get(handle(gcf),'JavaFrame')
jFrame =
com.mathworks.hg.peer.FigurePeer@cdbd96
 
>> jFrame.setMaximized(true);   % to maximize the figure
>> jFrame.setMaximized(false);  % to un-maximize the figure

Minimization

To the best of my knowledge, there are no solutions for minimizing figure windows that use documented Matlab features. Again, this can be done using either native Windows API, or the platform-independent JavaFrame:

>> jFrame.setMinimized(true);   % to minimize the figure
>> jFrame.setMinimized(false);  % to un-minimize the figure

Usage notes

Maximized and Minimized are mutually-exclusive, meaning that no more than one of them can be 1 (or true) at any time. This is automatically handled – users only need to be aware that a situation in which a window is both maximized and minimized at the same time is impossible (duh!).

There are several equivalent manners of setting jFrame‘s Maximized and Minimized property values, and your choice may simply be a matter of aesthetics and personal taste:

% Three alternative possibilities of setting Maximized:
jFrame.setMaximized(true);
set(jFrame,'Maximized',true);   % note interchangeable 1< =>true, 0< =>false
jFrame.handle.Maximized = 1;

jFrame follows Java convention: the accessor method that retrieves boolean values is called is<Propname>() instead of get<Propname>. In our case: isMaximized() and isMinimized():

flag = jFrame.isMinimized;        % Note: isMinimized, not getMinimized
flag = get(jFrame,'Minimized');
flag = jFrame.handle.Minimized;

In some old Matlab releases, jFrame did not possess the Maximized and Minimized properties, and their associated accessor methods. In this case, use the internal FrameProxy which has always contained them:

>> jFrameProxy = jFrame.fFigureClient.getWindow() 
jFrameProxy =
com.mathworks.hg.peer.FigureFrameProxy$FigureFrame[fClientProxyFrame,227,25,568x502,invalid,layout=java.awt.BorderLayout,title=Figure 1,resizable,normal,defaultCloseOperation=DO_NOTHING_ON_CLOSE,...]
 
>> % Three alternative possibilities of setting Minimized:
>> jFrameProxy.setMinimized(true);
>> set(jFrameProxy,'Minimized',true);
>> jFrameProxy.handle.Minimized = true;

Using FrameProxy for figure minimization and maximization works correctly on both old and new Matlab releases; using jFrame is slightly simpler but only works on recent Matlab releases. Depending on your needs you may choose to use either of these. They are entirely equivalent.

When either the Maximized or Minimized properties are changed back to false, the window is restored to regular mode, which is the FrameProxy‘s RestoredLocation and RestoredSize.

Use of the JavaFrame property

Note that all this relies on the undocumented hidden figure property JavaFrame, which issues a standing warning (since Matlab release R2008a) of becoming obsolete in some future Matlab release (HG2?):

>> jFrame = get(gcf,'JavaFrame')
Warning: figure JavaFrame property will be obsoleted in a future release.
For more information see the JavaFrame resource on the MathWorks web site.
(Type "warning off MATLAB:HandleGraphics:ObsoletedProperty:JavaFrame" to suppress this warning.) 

jFrame =
com.mathworks.hg.peer.FigurePeer@1ffbad6

To remove the above warning I have used (note the handle wrapper, as suggested by Donn Shull):

jFrame = get(handle(gcf),'JavaFrame')

If and when JavaFrame does become obsolete in some future Matlab version, be sure to look in this blog for workarounds.

You may also wish to inform MathWorks on the dedicated webpage that they have set up for specifically this reason (http://www.mathworks.com/javaframe), how you are using JavaFrame and why it is important for you. This may help them to decide whether to keep JavaFrame or possibly add the functionality using other means.

Do you have a smart use for the figure’s minimization or maximization feature? or another use for JavaFrame? If so, please share your ideas in a comment below.

 
Related posts:
  1. Enable/disable entire figure window Disabling/enabling an entire figure window is impossible with pure Matlab, but is very simple using the underlying Java. This article explains how....
  2. Transparent Matlab figure window Matlab figure windows can be made fully or partially transparent/translucent or blurred - this article explains how...
  3. Blurred Matlab figure window Matlab figure windows can be blurred using a semi-transparent overlaid window - this article explains how...
  4. Detecting window focus events Matlab does not have any documented method to detect window focus events (gain/loss). This article describes an undocumented way to detect such events....
 

Docking figures in compiled applications

$
0
0

Up until Matlab release R2008a, the Matlab compiler enabled compiled Matlab applications to have dockable figure windows, which docked into a “Figures” container. Starting with R2008a, the compiler removed the figure’s docking capability and figures can no longer be docked.

Well, at least not officially :-)

The following trick restores the docking controls to figures in R2008a-compiled applications, enabling figure docking. Simply add one or both of the following alternatives in your application, after the figure has been created:

% Alternative #1 - uses pure Matlab
set(hFig, 'DockControls', 'on');
 
% Alternative #2 - uses the underlying Java frame
jFrame = get(handle(hFig), 'JavaFrame');
try
   % This works up to R2011a
   jFrame.fFigureClient.setClientDockable(true);
catch
   % This works from R2008b and up
   jFrame.fHG1Client.setClientDockable(true);
end

where hFig is the figure handle. This will have no effect for the regular interpreted (non-compiled) run of the application, where these controls are ‘on’ by default. But in the compiled application, although it may erroneously report that the controls are ‘on’, they are in fact ‘off’, so turning them ‘on’ fixes the problem.

Matlab figure docking control

Matlab figure docking control

Note: the two variants in alternative #2 above are actually identical, it is simply that the relevant field name has changed: Up to R2008a, only the fFigureClient existed; in R2008b, the fHG1Client field was added, which was simply an alias for fFigureClient, holding the same reference handle, so either of these fields could be used (a corresponding fHG2Client was also added – more on HG1 and HG2 here). In R2011b (at least the pre-release), the fFigureClient alias field was dropped and only fHG1Client remained. While the field name has changed, the underlying docking functionality appears to have remained stable over all these releases. For the record, in answer to a user question below, these fields can be listed using the built in fieldnames function:

% R2008b - R2011a:
>> fieldnames(jFrame)
ans = 
    'fFigureClient'
    'fHG2Client'
    'fHG1Client'
    'fUseHG2'
    'UICONTROLBACKGROUND_OS'
    'UICONTROLBACKGROUND_COMPATIBLE'

I was reminded of this trick by Aurélien’s recent comment, where he mentions MathWorks so-called workaround for this problem, which (IMHO) is really not a work-around at all: MathWorks advises to modify our application to use – would you believe this – tabbed panels to “dock” the separate figures contents onto separate panels. Not to mention the fact that this so-called “solution” relies on undocumented and unsupported Matlab functionality (that of tabbed-panels) and requires major rework of existing applications, it also results in far inferior look-and-feel than simple docking as G-d intended…

Since I have demonstrated above that the docking functionality actually exists in compiled apps just as in the interpreted m-file apps, I do not understand why MathWorks took such great pains to prevent this important functionality in the compiler. There must be some important reason for this, but I cannot think of any. Perhaps if there is enough public demand, MathWorks will agree to return the docking functionality.

Unfortunately, I recently discovered that in the most recent compiler, that ships with R2011a, alternative #1 above (which uses pure Matlab) no longer works. Sometime between R2008a and R2011a MathWorks discovered my first back-door and closed it. Such a pity…

Luckily, alternative #2 (which uses the underlying Java frame object) seems to still work, even on R2011a.

I still haven’t tested this on R2011b’s compiler (whose pre-release has become available for download yesterday), but hopefully the trick above will continue to work on R2011b and on subsequent releases – please tell me if you find out otherwise.

 
Related posts:
  1. Disabling menu entries in deployed docked figures Matlab's standard menu items can and should be removed from deployed docked figures. This article explains how. ...
  2. Speeding up compiled apps startup The MCR_CACHE_ROOT environment variable can reportedly help to speed-up deployed Matlab executables....
  3. Splash window for deployed applications Deployed (compiled) Matlab applications take a long time to load. I present a splash window that loads immadiately, solving this problem. ...
  4. Minimize/maximize figure window Matlab figure windows can easily be maximized, minimized and restored using a bit of undocumented magic powder...
 

Customizing menu items part 1

$
0
0

Over the past years, I have not posted articles dealing with menu items. I have shown how to directly access menu items’ hidden handles, but not much more than that. A year ago I promised a mini-series on menu customizations, and it’s time to keep my promise. In today’s article, the first in the mini-series, I will present several undocumented menu customization topics that rely on pure-Matlab (i.e, no Java today). The next article in this series will focus on Java-based customizations.

Invoking menu item callbacks

As noted above, a figure window’s menu items can be directly accessed. Once we access a menu item’s handle, we can extract its Callback property and directly invoke it (for example, using the semi-documented hgfeval function). Note that menu callbacks are kept in Callback, while toolbar callbacks are kept in ClickedCallback.

Menu callbacks generally use internal semi-documented functions (i.e., having a readable help section but no doc, online help, or official support), which are part of Matlab’s uitools folder. These functions are specific to each top-level menu tree: filemenufcn, editmenufcn, viewmenufcn, insertmenufcn, toolsmenufcn, desktopmenufcn, winmenu, and helpmenufcn implement the figure’s eight respective top-level menu trees’ callbacks. These functions accept an optional figure handle (otherwise, gcbf is assumed), followed by a string specifying the specific menu item whose action needs to be run. webmenufcn implements the Help menu’s Web Resources sub-menu callbacks in a similar manner.

Use of these functions makes it easy to invoke a menu action directly from our Matlab code: instead of accessing the relevant menu item and invoking its Callback, we simply find out the menu item string in advance and use it directly. For example,

filemenufcn FileClose;
editmenufcn(hFig,'EditPaste');

uimenufcn is a related fully-undocumented (built-in) function, available since Matlab R11 (late 1990s). It accepts a figure handle (or the zero [0] handle to indicate the desktop) and action name. For example, the fully-documented commandwindow function uses the following code to bring the Command Window into focus:

uimenufcn(0, 'WindowCommandWindow');

Customizing menus via uitools

makemenu is another semi-documented uitool function that enables easy creation of hierarchical menu trees with separators and accelerators. It is a simple and effective wrapper for uimenu. makemenu is a useful function that has been made obsolete (grandfathered) without any known replacement.

makemenu accepts four parameters: a figure handle, a char matrix of labels (‘>’ indicating sub item, ‘>>’ indicating sub-sub items etc.; ‘&’ indicating keyboard shortcut; ‘^x’ indicating an accelerator key; ‘-’ indicating a separator line), a char matrix of callbacks, and an optional char matrix of tags (empty by default). makemenu makes use of another semi-documented grandfathered function, menulabel, to parse the specified label components. makemenu returns an array of handles of the created uimenu items:

labels = str2mat('&File', ...    % File top menu
           '>&New^n', ...           % File=>New
           '>&Open', ...            % File=>Open
           '>>Open &document^d', ...    % File=>Open=>doc
           '>>Open &graph^g', ...       % File=>Open=>graph
           '>-------', ...          % File=>separator line
           '>&Save^s', ...          % File=>Save
           '&Edit', ...		% Edit top menu
           '&View', ...		% View top menu
           '>&Axis^a', ...          % View=>Axis
           '>&Selection region^r'); % View=>Selection
calls = str2mat('', ...		% no action: File top menu
           'disp(''New'')', ...
           '', ...			% no action: Open sub-menu
           'disp(''Open doc'')', ...
           'disp(''Open graph'')', ...
           '', ...			% no action: Separator
           'disp(''Save'')', ...
           '', ...			% no action: Edit top menu
           '', ...			% no action: View top menu
           'disp(''View axis'')', ...
           'disp(''View selection region'')');
handles = makemenu(hFig, labels, calls);
set(hFig,'menuBar','none');

A simple figure menu

A simple figure menu

Customizing menus via HTML

Since menu items share the same HTML/CSS support feature as all Java Swing labels, we can specify font size/face/color, bold, italic, underline, superscript/subscript, and practically any HTML formatting.

Note that some features, such as the font or foreground/background colors, have specific properties that we can set using the Java handle, instead of using HTML. The benefit of using HTML is that it enables setting all the formatting in a single property. HTML does not require using Java – just pure Matlab (see the following example).

Multi-line menu items can easily be done with HTML: simply include a <br> element in the label – the menu item will split into two lines and automatically resize vertically when displayed:

txt1 = '<html><b><u><i>Save</i></u>';
txt2 = '<font color="red"><sup>this file</sup></font></b></html>';
txt3 = '<br />this file as...';
set(findall(hFig,'tag','figMenuFileSave'),   'Label',[txt1,txt2]);
set(findall(hFig,'tag','figMenuFileSaveAs'), 'Label',[txt1,txt3]);

A multi-line HTML-rendered menu item

A multi-line HTML-rendered menu item

set(hMenuItem, 'Label',['<html>&2: C:\My Documents\doc.txt<br />'
   '<font size="-1" face="Courier New" color="red">&nbsp;&nbsp; '
   'Date: 15-Jun-2011 13:23:45<br />&nbsp;&nbsp; Size: 123 KB</font></html>']);

HTML-rendered menu items

HTML-rendered menu items

Much more complex customizations can be achieved using Java. So stay tuned to part 2 of this mini-series…

Note: Menu customization is explored in depth in section 4.6 of my book.

 
Related posts:
  1. Customizing menu items part 2 Matlab menu items can be customized in a variety of useful ways using their underlying Java object. ...
  2. Customizing menu items part 3 Matlab menu items can easily display custom icons, using just a tiny bit of Java magic powder. ...
  3. Customizing Workspace context-menu Matlab's Workspace table context-menu can be configured with user-defined actions - this article explains how....
  4. Customizing uitree nodes – part 1 This article describes how to customize specific nodes of Matlab GUI tree controls created using the undocumented uitree function...
 

Disabling menu entries in deployed docked figures

$
0
0

Last week I presented an article explaining how to solve an issue with deployed (compiled) Matlab applications. Today I’d like to welcome guest blogger Alexander Mering, who will explain how to disable standard Matlab menu items in deployed docked Matlab figures. Alexander has been an avid follower of this blog, and from his CSSM posts we can tell that he’s been heavily using advanced GUI features presented in this blog. His article today nicely shows how we can use different building-blocks presented in different articles in this blog, to achieve something new and useful.

As Yair pointed out in many occasions, the power of Matlab could be greatly enhanced using the underlying Java mechanism. To me, while developing a larger standalone tool for technical calculations, these hints are worth a mint (as I guess for many of you).

One of these very useful hints is the ability to dock figure windows in standalone applications. This perfectly fits to my understanding of a “clean desktop”, i.e., having as less as possible separate windows. Since in many calculations dozens of figures are generated, the desktop gets up crowded very fast – if these are not grouped. So docking is essential (at least for me). Unfortunately there seems to be a serious problem with the resulting menu entries (at least in R2011b on Win XP), leading to a crash of the standalone application. Based on the posts by Yair, I will sketch a possible route to avoid this issue.

The symptom

In the compiled application, docking could be accomplished by accessing the figure frame’s underlying Java level:

% get java frame for sophisticated modifications
jframe = get(handle(figure_handle), 'JavaFrame');
 
% allow docking
jframe.fHG1Client.setClientDockable(true)

Using this modification, the user is now allowed to dock and undock the figures manually. For initial docking of the figure,

javaFrame.fHG1Client.setClientWindowStyle(true,false)

could be used during figure creation. Unfortunately, there are menu entries in the Figures container which are either unwanted (since not usable) or even directly crash the standalone applications:

Useless Debug menu items in deployed applications

Useless Debug menu items in deployed applications

Menu items crashing deployed applications

Menu items crashing deployed applications

Since crashing menu entries will be found and used by end-users (though these are somehow hidden), these prohibit the usage of the docking feature as long as these could be invoked. So how can we disable / remove these menu items?

The unsuccessful solution

Unfortunately, the straight forward solution of getting the handle to the Figures containers’ menu bar and remove the unwanted items does not work. The reason for this is the (to me unexpected behavior) that the menu bar seems to be rebuilt whenever a figure is docked/undocked.

This is actually the same behavior that automatically rebuilds the Editor’s menu bar whenever an editor file is added/removed. The Editor container is basically the same docking container as the Figures container, as shown by Yair’s setFigDockGroup utility:

Docking a figure in the Editor container (group)

Docking a figure in the Editor container (group)

Therefore, removing unwanted menu items only helps until the next figure docking/undocking. To make it even worse: also pressing any of the buttons within the document bar (if having more than one figure) somehow rebuilds the entire menu structure, reverting our changes. So the solution becomes a bit more complex.

The working solution

For the working solution, many pieces presented by Yair should be put together. The first piece results from the question how to detect a dock/undock event. Since no such callback is defined, we need to use a property listener as Yair showed in his post about the continuous slider callback:

% listen to the WindowStyle property to detect docking / undocking events
hProp = findprop(handle(figure_handle),'WindowStyle');  % a schema.prop object
 
% if the event occurs, invoke the callback
hlistener = handle.listener(handle(figure_handle), hProp, 'PropertyPostSet',{@(source, event) Callback_DockingFcn});
 
% attach listener to the GUI since it needs to be known (as long as the figure exists)
setappdata(figure_handle, 'Handle_Listener', hlistener);

Now, whenever the figure’s WindowStyle property (which controls the docking state) is changed, our docking callback is invoked.

The next piece of the puzzle takes care of the menu rebuild whenever any document bar button is pressed. To overcome this behavior, the idea is to define the MousePressed callback of theses buttons to (again) invoke the docking callback. This is necessary for two reasons: First, pressing the button (i.e., changing the current figure) rebuilds the menu, overwriting our changed menu entries. Secondly, all other buttons are also somehow rebuilt and the callbacks are removed if a new figure is docked.

The handles to the document bar buttons could be found using Yair’s findjobj utility. We have already seen that the Editor container is analogous to the Figures docking container. So let’s use the method described by Yair for accessing the Editor container, to access the Figures container:

figures_container = javaObjectEDT(matlab_instance.getGroupContainer('Figures'));
figures_frame = javaObjectEDT(figures_container.getTopLevelAncestor);

Once we get the Java Frame for the Figures container, the buttons could be found by digging through its children. This finally allows to set the callback using

DTDocumentBar = javaObjectEDT(figures_frame.getRootPane.getLayeredPane.getComponent(1).getComponent(1).getComponent(0).getComponent(0).getComponent(1).getComponent(0));
ContentPanel = javaObjectEDT(DTDocumentBar.getComponent(0).getComponent(0).getViewport.getView);
 
if ~isempty(ContentPanel.getComponents) % less than two documents are open and no DTDocumentbar exists
    drawnow; pause(0.05)
    GroupPanel = javaObjectEDT(ContentPanel.getComponent(0));
    GroupPanel_Elements = javaObjectEDT(GroupPanel.getComponents);
 
    % change the MousePressed Callback for each of the buttons to invoke the function which disables the menu
    for n = 1 : GroupPanel.getComponentCount
        thisElement = GroupPanel_Elements(n);
        if isequal(char(thisElement.getClass.toString), 'class com.mathworks.widgets.desk.DTDocumentBar$DocumentButton')
            set(handle(thisElement, 'CallbackProperties'), 'MousePressedCallback', {@(source, event) Cbrake_Callback_Diagrams_DockingFcn})
        end
    end
    drawnow; pause(0.05)
end

where the loop runs through the current buttons in the document bar.

As the last step of our procedure, we finally remove (or disable) the menu entries which are unwanted. This is achieved by extracting the handle to the Figures menu by:

figures_menu = javaObjectEDT(figures_frame.getJMenuBar);

Running through the menu items, searching for the unwanted entries (as long as they have pre-defined menu-item names) at the end sets us into the position to take care of the menu items:

% run through top-level menu items
for n = 1 : figures_menu.getMenuCount
    % completely deactivate Debugging options
    if isequal(char(figures_menu.getMenu(n-1).getName), 'DesktopDebugMenu')
        DesktopDebugMenuPos = n - 1;
    end
 
    % Remove some items from the Desktop menu
    if isequal(char(figures_menu.getMenu(n-1).getName), 'DesktopMenu')
        desktop_menu = javaObjectEDT(figures_menu.getMenu(n-1));
 
        DeletePos = [];
        for m = 1: desktop_menu.getMenuComponentCount
            if ismember({char(desktop_menu.getMenuComponent(m-1).getName)}, ...
                        {'ToggleFigure PaletteCheckBoxMenuItem', 'TogglePlot BrowserCheckBoxMenuItem', 'ToggleProperty EditorCheckBoxMenuItem'})
                DeletePos(end+1) = m - 1;
            end
        end
 
        for m = length(DeletePos) : -1 : 1
            desktop_menu.remove(DeletePos(m))
        end
    end
end
 
% finally remove the "Debug" menu
if ~isempty(DesktopDebugMenuPos)
    figures_menu.remove(DesktopDebugMenuPos)
end

Since this callback is invoked whenever a figure is docked/undocked, or the currently shown figure is changed (by pressing the document bar button), all unwanted menu items within the Figures menu could be removed.

As a result, the new Figures container menu looks like:

Deployed menu without unwanted items

Deployed menu without unwanted items

Remarks

I must admit that above solution is still imperfect. For instance, sometimes there is a larger delay between the docking (or button press event) and the removing of the menu item. Nevertheless, this solution allows me to distribute my standalone with docked figures without having menu items directly leading to a fatal error.

Obviously, the solution has some positive side effects:

  • As could be seen from the screen shot, the Matlab desktop becomes available also within your compiled applications. This might be wanted. If not, it could be removed the same way as the other menu items. One drawback of making the desktop available should be mentioned: In my tests, the standalone Matlab desktop shows the whole list of recent files I have in the Matlab editor at compile time. This is somehow ugly but not that problematic.
  • Additional menu items could be added, giving more possibilities for modifications.

I have uploaded a first version of the docking and creation functions, together with a small test project, to the Matlab file Exchange. Readers are welcome to download the code and send me improvement suggestions. Or you could simply leave a comment below.

 
Related posts:
  1. Docking figures in compiled applications Figures in compiled applications cannot officially be docked since R2008a, but this can be done using a simple undocumented trick....
  2. Customizing menu items part 2 Matlab menu items can be customized in a variety of useful ways using their underlying Java object. ...
  3. Customizing menu items part 3 Matlab menu items can easily display custom icons, using just a tiny bit of Java magic powder. ...
  4. Customizing Workspace context-menu Matlab's Workspace table context-menu can be configured with user-defined actions - this article explains how....
 

Pinning annotations to graphs

$
0
0

Many Matlab users are aware of Matlab’s annotation functionality, which enables us to assign graphic elements such as arrows, lines, ellipses and text labels to Matlab figures. Matlab has a corresponding built-in function, annotation, that enables creation of annotation objects. Through the handle returned by annotation we can customize the annotation’s appearance (for example, line width/style or text font properties).

Limitations of Matlab annotations

Unfortunately, annotation has several major deficiencies, that are in fact related:

A Matlab text-arrow annotation (unpinned)

A Matlab text-arrow annotation (unpinned)

  1. annotation requires us to specify the annotation’s position in normalized figure units. Often, we are interested in an annotation on a plot axes that does NOT span the entire figure’s content area. To correctly convert the position from plot axes data coordinates to figure coordinates requires non-trivial calculations.
  2. The created annotation is NOT pinned to the plot axes by default. This means that the annotation retains its relative position in the figure when the plot is zoomed, panned or rotated. This results in unintelligible and misleading annotations. We can indeed pin the annotation to the graph, but this requires delicate manual interaction (click the Edit Plot toolbar icon, then right-click the relevant annotation end-point, then select “Pin to Axes” from context menu). Unfortunately, the annotation handle does not provide a documented way to do this programmatically.
  3. Finally, the annotation objects are only displayed on top of plot axes – they are obscured by any GUI uicontrols that may happen to be present in the figure.

All of these limitations originate from the underlying implementation of annotation objects in Matlab. This is based on a transparent hidden axes that spans the entire figure’s content area, on which the annotations are being drawn (also called the scribe layer). The annotations may appear to be connected to the plot axes, but this is merely a visual illusion. In fact, they are located in a separate axes layer. For this reason, annotation requires figure position – in fact, the annotation has no information about the axes beneath it. Since plot axes are always obscured by uicontrols, so too is the annotation layer.

Matlab’s implementation of annotation is an attempt to replicate Java’s standard glass-pane mechanism. But whereas the Java glass-pane is a true transparent layer, on top of all other window components (examples), Matlab’s implementation only works for axes.

Oh well, it’s better than nothing, I guess. But still, it would be nice if we could specify the annotation in graph (plot axes) data units, and have it pinned automatically without requiring manual user interaction.

Debugging the problem

The obvious first place to start debugging this issue is to go to the annotation handle’s context-menu (accessible via the UIContextMenu property), drill down to the “Pin” menu item and take a look at its callback. We could then use the hgfeval function to execute this callback programmatically. Unfortunately, this does not work well, because the context-menu is empty when the annotation is first created. A context-menu is only assigned to the annotation after the Edit Plot toolbar button and then the annotation object are clicked.

Being too lazy in nature to debug this all the way through, I opted for an easier route: I started the Profiler just prior to clicking the context-menu’s “Pin to Axes”, and stopped it immediately afterwards. This showed me the code path (beneath %matlabroot%/toolbox/matlab/scribe/), and placing breakpoints in key code lines enabled me to debug the process step-by-step. This in turn enabled me to take the essence of the pinning code and implement it in my stand-alone application code.

Believe me when I say that the scribe code is complex (anyone say convoluted?). So I’ll spare you the gruesome details and skip right to the chase.

The solution

Positioning the annotation in axes data units

The first step is to ensure that the initial annotation position is within the figure bounds. Otherwise, the annotation function will shout. Note that it is ok to move the annotation outside the figure bounds later on (via panning/zooming) – it is only the initial annotation creation that must be within the figure bounds (i.e., between 0.0-1.0 in normalized X and Y units):

% Prepare the annotation's X position
% Note: we need 2 X values: one for the annotation's head, another for the tail
x = [xValue, xValue];
xlim = get(hAxes,'XLim');
 
% Prepare the annotation's Y position
% Note: we need 2 Y values: one for the annotation's head, another for the tail
% Note: we use a static Y position here, spanning the center of the axes.
% ^^^^  We could have used some other Y data value for this
yLim = get(hAxes,'YLim');
y = yLim(1) + 0*sum(yLim) + [0.1,0]*diff(ylim);  % TODO: handle reverse, log Y axes
 
% Ensure that the annotation fits in the window by enlarging
% the axes limits as required
if xValue < xlim(1) || xValue > xlim(2)
    hold(hAxes,'on');
    plot(hAxes,xValue,y(2),'-w');
    drawnow;
 
    % YLim may have changed, so recalculate y
    yLim = get(hAxes,'YLim');
    y = yLim(1) + 0*sum(yLim) + [0.1,0]*diff(ylim);  % TODO: handle reverse, log Y-axes
end

Next, we convert our plot data units, in order to get the annotation’s requested position in the expected figure units. For this we use %matlabroot%/toolbox/matlab/scribe/@scribe/@scribepin/topixels.m. This is an internal method of the scribepin UDD class, so in order to use it we need to create a dummy scribepin object. topixels then converts the dummy object’s position from axes data units to pixel units. We then use the undocumented hgconvertunits function to convert from pixel units into normalized figure units:

% Convert axes data position to figure normalized position
% uses %matlabroot%/toolbox/matlab/scribe/@scribe/@scribepin/topixels.m
scribepin = scribe.scribepin('parent',hAxes,'DataAxes',hAxes,'DataPosition',[x;y;[0,0]]');
figPixelPos = scribepin.topixels;
hFig = ancestor(hAxes,'figure');
figPos = getpixelposition(hFig);
figPixelPos(:,2) = figPos(4) - figPixelPos([2,1],2);
figNormPos = hgconvertunits(hFig,[figPixelPos(1,1:2),diff(figPixelPos)],'pixels','norm',hFig);
annotationX = figNormPos([1,1]);
annotationY = figNormPos([2,2]) + figNormPos(4)*[1,0];
Pinning the annotation to the axes data

Finally, we use the annotation handle’s pinAtAffordance() method and set the Pin.DataPosition property to the requested X,Y values (we need to do both of these, otherwise the annotation will jump around when we zoom/pan):

A Matlab text-arrow annotation (pinned)

A Matlab text-arrow annotation (pinned)

% Ensure that the annotation is within the axes bounds, then display it
if any([annotationX,annotationY] < 0) || any([annotationX,annotationY] > 1)
    % Annotation position is outside axes boundaries, so bail out without drawing
    hAnnotation = handle([]);
elseif ~isempty(annotationObj)
    % Create a text-arrow annotation with the requested string at the requested position
    hAnnotation = handle(annotation('textarrow', annotationX, annotationY, ...
                                    'String',annotationStr, 'TextColor','b', 'Tag','annotation'));
 
    % Example for setting annotation properties
    hAnnotation.TextEdgeColor = [.8,.8,.8];
 
    % Pin the annotation object to the required axes position
    % Note: some of the following could fail in certain cases - never mind
    try
        hAnnotation.pinAtAffordance(1);
        hAnnotation.pinAtAffordance(2);
        hAnnotation.Pin(1).DataPosition = [xValue, y(1), 0];
        hAnnotation.Pin(2).DataPosition = [xValue, y(2), 0];
    catch
        % never mind - ignore (no error)
    end
end

p.s. Notice that all this relies on pure Matlab code (i.e., no mention of the dreaded J-word…). In fact, practically the entire scribe code is available in m-file format in the base Matlab installation. Masochistic readers may find many hours of pleasure sifting through the scribe code functionality for interesting nuggets such as the one above. If you ever find any interesting items, please drop me an email, or post a comment below.

Undocumented annotation properties

Annotation objects have a huge number of undocumented properties. In fact, they have more undocumented properties than documented ones. You can see this using my uiinspect or getundoc utilities. Here is the list for a simple text-arrow annotation, such as the one that we used above:

>> getundoc(hAnnotation)
ans = 
              ALimInclude: 'on'
                   Afsize: 6
          ApplicationData: [1x1 struct]
                 Behavior: [1x1 struct]
              CLimInclude: 'on'
               ColorProps: {5x1 cell}
     EdgeColorDescription: 'Color'
        EdgeColorProperty: 'Color'
                  Editing: 'off'
                EraseMode: 'normal'
     FaceColorDescription: 'Head Color'
        FaceColorProperty: 'HeadColor'
             FigureResize: 0
            HeadBackDepth: 0.35
                HeadColor: [0 0 0]
            HeadColorMode: 'auto'
            HeadEdgeColor: [0 0 0]
            HeadFaceAlpha: 1
            HeadFaceColor: [0 0 0]
               HeadHandle: [1x1 patch]
         HeadHypocycloidN: 3
            HeadLineStyle: '-'
            HeadLineWidth: 0.5
               HeadRosePQ: 2
                 HeadSize: 10
             HelpTopicKey: ''
          IncludeRenderer: 'on'
                 MoveMode: 'mouseover'
                    NormX: [0.2 0.4]
                    NormY: [0.5 0.7]
                      Pin: [0x1 double]
                   PinAff: [1 2]
           PinContextMenu: [2x1 uimenu]
                PinExists: [0 0]
              PixelBounds: [0 0 0 0]
        PropertyListeners: [8x1 handle.listener]
        ScribeContextMenu: [9x1 uimenu]
                 Selected: 'off'
             Serializable: 'on'
                ShapeType: 'textarrow'
                    Srect: [2x1 line]
           StoredPosition: []
                TailColor: [0 0 0]
               TailHandle: [1x1 line]
            TailLineStyle: '-'
            TailLineWidth: 0.5
     TextColorDescription: 'Text Color'
            TextColorMode: 'auto'
        TextColorProperty: 'TextColor'
        TextEdgeColorMode: 'manual'
            TextEraseMode: 'normal'
               TextHandle: [1x1 text]
         UpdateInProgress: 0
    VerticalAlignmentMode: 'auto'
              XLimInclude: 'on'
              YLimInclude: 'on'
              ZLimInclude: 'on'

 
Related posts:
  1. Accessing plot brushed data Plot data brushing can be accessed programmatically using very simple pure-Matlab code...
  2. Plotly graphs in IPython Notebook Plotly graphs can be embedded in an IPython Notebook directly from Matlab. ...
  3. Plot LimInclude properties The plot objects' XLimInclude, YLimInclude, ZLimInclude, ALimInclude and CLimInclude properties are an important feature, that has both functional and performance implications....
  4. Plotly graphs Plotly charts can be created and customized in Matlab. ...
 

Customizing the standard figure toolbar, menubar

$
0
0

A few days ago, a client asked me to integrate an MRU (most-recently-used) file list in a Matlab GUI window. The naive approach was to add a new “Recent files” main menu, but this would look bad. Today I explain how to integrate the MRU list into the toolbar’s standard “Open File” button, as well as into the standard “File” main menu.

Note: this relies on earlier articles about customizing the figure menubar, so if you are not comfortable with this topic you might benefit from reading these earlier articles.

Customizing the standard “File” main menu is easy. First, let’s find the “File” main menu’s handle, and add an MRU sub-menu directly to it:

hFileMenu = findall(gcf, 'tag', 'figMenuFile');
hMruMenu = uimenu('Label','Recent files', 'Parent',hFileMenu);

Our new MRU menu item is created at the end (in this case, at the bottom of the “File” main menu list). Let’s move it upward, between “New” and “Open…”, by reordering hFileMenu‘s Children menu items:

hAllMenuItems = allchild(hFileMenu);
set(hFileMenu, 'Children',fliplr(hAllMenuItems([2:end-1,1,end])));  % place in 2nd position, just above the "Open" item

Now let’s fix the “Open…” menu item’s callback to point to our custom openFile() function (unfortunately, the “Open…” menu item has no tag, so we must rely on its label to get its handle):

hOpenMenu = findall(hFileMenu, 'Label', '&Open...');
set(hOpenMenu, 'Callback',@openFile);

Finally, let’s add the MRU list as a sub-menu of the new hMruMenu. I assume that we have a getMRU() function in our code, which returns a cell-array of filenames:

% Add the list of recent files, one item at a time
filenames = getMRU();
for fileIdx = 1 : length(filenames)
    uimenu(hMruMenu, 'Label',filenames{fileIdx}, 'Callback',{@openFile,filenames{fileIdx}});
end

Modified standard figure menu-bar

Modified standard figure menu-bar


Clicking the main “Open…” menu item calls our openFile() function without the optional filename input argument, while selecting one of the MRU files will call the openFile() function with that specific filename as input. The openFile() function could be implemented something like this:

% Callback for the open-file functionality (toolbar and menubar)
function openFile(hObject,eventData,filename)
    % If no filename specified, ask for it from the user
    if nargin < 3
        filename = uigetfile({'*.csv','Data files (*.csv)'}, 'Open data file');
        if isempty(filename) || isequal(filename,0)
            return;
        end
    end
 
    % Open the selected file and read the data
    data = readDataFile(filename);
 
    % Update the display
    updateGUI(data)
end

We can take this idea even further by employing HTML formatting, as I have shown in my first article of the menubar mini-series:

HTML-rendered menu items

HTML-rendered menu items

Customizing the standard toolbar’s “Open File” button

Note: this relies on earlier articles about customizing the figure toolbar, so if you are not comfortable with this topic you might benefit from reading these earlier articles.

The basic idea here is to replace the standard toolbar’s “Open File” pushbutton with a new uisplittool button that will contain the MRU list in its picker-menu.

The first step is to get the handle of the toolbar’s “Open File” button:

hOpen = findall(gcf, 'tooltipstring', 'Open File');
hOpen = findall(gcf, 'tag', 'Standard.FileOpen');  % Alternative

The second alternative is better for non-English Matlab installations where the tooltip text may be different, or in cases where we might have another GUI control with this specific tooltip. On the other hand, the 'Standard.FileOpen' tag may be different in different Matlab releases. So choose whichever option is best for your specific needs.

Assuming we have a valid (non-empty) hOpen handle, we get its properties data for later use:

open_data = get(hOpen);
hToolbar = open_data.Parent;

We have all the information we need, so we can now simply delete the existing toolbar open button, and create a new split-button with the properties data that we just got:

delete(hOpen);
hNewOpen = uisplittool('Parent',hToolbar, ...
                       'CData',open_data.CData, ...
                       'Tooltip',open_data.TooltipString, ...
                       'ClickedCallback',@openFile);

As with the menubar, the button is now created, but it appears on the toolbar's right edge. Let's move it to the far left. We could theoretically reorder hToolbar's Children as for the menubar above, but Matlab has an internal bug that causes some toolbar buttons to misbehave upon rearranging. Using Java solves this:

drawnow;  % this innocent drawnow is *very* important, otherwise Matlab might crash!
jToolbar = get(get(hToolbar,'JavaContainer'),'ComponentPeer');
jButtons = jToolbar.getComponents;
jToolbar.setComponentZOrder(jButtons(end),2);  % Move to the position between "New" and "Save"
jToolbar.revalidate;  % update the toolbar's appearance (drawnow will not do this)

Finally, let's add the list of recent files to the new split-button's picker menu:

% (Use the same list of filenames as for the menubar's MRU list)
jNewOpen = get(hNewOpen,'JavaContainer');
jNewOpenMenu = jNewOpen.getMenuComponent;
for fileIdx = 1 : length(filenames)
    jMenuItem = handle(jNewOpenMenu.add(filenames{fileIdx}),'CallbackProperties');
    set(jMenuItem,'ActionPerformedCallback',{@openFile,filenames{fileIdx}});
end

Modified standard figure toolbar

Modified standard figure toolbar

Clicking the main Open button calls our openFile() function without the optional filename input argument, while clicking the picker button (to the right of the main Open button) and selecting one of the files will call the openFile() function with that specific filename as input.

That's it. Quite painless in fact.

 
Related posts:
  1. Customizing figure toolbar background Setting the figure toolbar's background color can easily be done using just a tiny bit of Java magic powder. This article explains how. ...
  2. Modifying default toolbar/menubar actions The default Matlab figure toolbar and menu actions can easily be modified using simple pure-Matlab code. This article explains how....
  3. Figure toolbar components Matlab's toolbars can be customized using a combination of undocumented Matlab and Java hacks. This article describes how to access existing toolbar icons and how to add non-button toolbar components....
  4. Figure toolbar customizations Matlab's toolbars can be customized using a combination of undocumented Matlab and Java hacks. This article describes how to customize the Matlab figure toolbar....
 

Customizing figure toolbar background

$
0
0

In one of my projects, I needed to present a radar (polar) plot. Such plots are usually drawn on a black background and I wanted all the plot controls to blend into this background.

Matlab figure having black toolbar background

Matlab figure having black toolbar background

For the plot itself I used a variation of Matlab’s buggy polar function, which I modified to enable proper dynamic resize / zoom / pan, bypass figure-renderer issues with patches and data-cursors, and other similar annoyances. Pretty standard stuff.

For the slider I’ve used a javax.swing.JSlider having a continuous-movement callback. Again, for readers of this blog this is nothing special:

[jSlider,hSlider] = javacomponent('javax.swing.JSlider',[0,0,.01,0.1],hFig);
set(hSlider, 'Units','norm','pos',[.15,0,.7,.05]);
set(jSlider, 'Background',java.awt.Color.black, ...
             'Value',0, 'Maximum',duration, ...
             'StateChangedCallback',{@cbSlider,hFig,axPlayback});

Setting the background color for all the GUI components to black was easy. But setting the toolbar’s background to black turned out to be a bit more interesting, and is the topic of this week’s article.

Standard Matlab figure toolbar - yuck!

Standard Matlab figure toolbar - yuck!

The first step, naturally, is to get the toolbar’s handle:

hToolbar = findall(hFig,'tag','FigureToolBar');

In my case, I programmatically create the figure and use the default figure toolbar, whose tag value is always ‘FigureToolBar’. If I had used a custom toolbar, I would naturally use the corresponding tag (for example, if you create a custom toolbar using GUIDE, then the tag name will probably be ‘toolbar1′ or something similar).

Since I’m setting the figure programmatically, I need to manually remove several unuseful toolbar controls. I do this by directly accessing the toolbar control handles:

delete(findall(hToolbar,'tag','Plottools.PlottoolsOn'))
delete(findall(hToolbar,'tag','Plottools.PlottoolsOff'))
delete(findall(hToolbar,'tag','Annotation.InsertColorbar'))
delete(findall(hToolbar,'tag','DataManager.Linking'))
delete(findall(hToolbar,'tag','Standard.EditPlot'))

For setting the bgcolor, we get the toolbar’s underlying Java component, then sprinkle some Java magic power:

% ensure the toolbar is visible onscreen
drawnow;
 
% Get the underlying JToolBar component
jToolbar = get(get(hToolbar,'JavaContainer'),'ComponentPeer');
 
% Set the bgcolor to black
color = java.awt.Color.black;
jToolbar.setBackground(color);
jToolbar.getParent.getParent.setBackground(color);
 
% Remove the toolbar border, to blend into figure contents
jToolbar.setBorderPainted(false);
 
% Remove the separator line between toolbar and contents
jFrame = get(handle(hFig),'JavaFrame');
jFrame.showTopSeparator(false);

Unfortunately, this is not enough. The reason is that some of Matlab’s standard toolbar icons use non-opaque Java button controls (thereby showing the new black bgcolor), whereas other icons use opaque buttons, with a hard-coded gray background (I feel like spanking someone…). I’ve already touched upon this issue briefly a few years ago.

Matlab figure toolbar with black background, some opaque buttons

Matlab figure toolbar with black background, some opaque buttons

Luckily, all is not lost: we simply need to loop over all the JToolBar’s components and force them to be non-opaque with a black bgcolor. In cases where the component is compound (e.g., the Brush Data uisplittool), we need to set the bgcolor for all the sub-components:

jtbc = jToolbar.getComponents;
for idx=1:length(jtbc)
    jtbc(idx).setOpaque(false);
    jtbc(idx).setBackground(color);
    for childIdx = 1 : length(jtbc(idx).getComponents)
        jtbc(idx).getComponent(childIdx-1).setBackground(color);
    end
end

…finally ending up with the blended appearance that appears at the top of this article.

 
Related posts:
  1. Customizing the standard figure toolbar, menubar The standard figure toolbar and menubar can easily be modified to include a list of recently-used files....
  2. Figure toolbar components Matlab's toolbars can be customized using a combination of undocumented Matlab and Java hacks. This article describes how to access existing toolbar icons and how to add non-button toolbar components....
  3. Figure toolbar customizations Matlab's toolbars can be customized using a combination of undocumented Matlab and Java hacks. This article describes how to customize the Matlab figure toolbar....
  4. uicontrol side-effect: removing figure toolbar Matlab's built-in uicontrol function has a side-effect of removing the figure toolbar. This was undocumented until lately. This article describes the side-effect behavior and how to fix it....
 

HG2 update

$
0
0

Exactly three years ago, I posted information (here and here) about Matlab’s upcoming new graphics engine, so-called HG2 (Handle Graphics version 2). At the time, I was sure that HG2 was just around the corner. But three years and six releases have passed, Matlab 7 turned into Matlab 8, and HG1 is still in use. I decided that it was time to revisit the latest state of HG2, as reflected in the latest release, R2013a (Matlab 8.1).

In the past few years, development of HG2 has apparently progressed to a stage where most of the kinks were ironed out. The latest HG2 appears to be quite stable, and in my experience most GUI/graphics utilities run as-is, without any need for tweaking. This is good news, which leads me to think that HG2 will be released soon. It is possible that this could happen as early as the upcoming release (R2013b, 8.2) but I have a gut feeling that it will be in R2014a. I also have a gut feeling that MathWorks will name that release 9.0 rather than 8.3, in keeping with its arch-rival Mathematica.

HG2 has improved grid lines, plot anti-aliasing and customizable everything (more on this below). Here’s a simple plot line as it appears in both HG1 and HG2:

hFig = figure('pos',[100,100,300,250]);
x = -10:0.1:10;
y = 1e7*sin(x)./x; 
hLine = plot(x,y);
box off; grid on;
title('HG2 plot');

HG1 plotHG2 plot

Same plot in HG1 and HG2

We can see that MathWorks has invested heavily in improving usability. The graphics are now much more visually appealing than before. A lot of thought has gone into small details such as the plot colors and the axes gray shades. The changes are small when taken separately, but the overall gestalt is striking. HG2 will definitely justify my license maintenance cost.

Highly customizable

Matlab in HG2 mode acts and behaves pretty much as you would expect. There are no visible changes to the Desktop or the graphics interface. The major difference is that all graphics handles, whether interactive controls (figure, uicontrols, uitables, etc.) or graph elements (axes, lines, patches, etc.) are instances of class objects (e.g., matlab.ui.Figure or matlab.graphics.chart.primitive.Line) rather than numeric values. This makes it easy to issue commands such as:

hFig.Color = 'w';
 
hAxes = gca;
hAxes.Title.Color = 'm';  % default: [0,0,0] = black
hAxes.YRuler.SecondaryLabel.String = 'millions';  % original: 'x10^{6}'
hAxes.YRuler.SecondaryLabel.FontAngle = 'italic';  % default: 'normal'
hAxes.YRuler.Axle.LineStyle = 'dotted';  % default: 'solid'
hAxes.YRuler.Axle.ColorData = uint8([0,100,0,255])';  %=dark green; default: [51 51 51 255], corresponding to [0.2 0.2 0.2 1]
hAxes.YBaseline.Color = 'b';  % default: [0.2 0.2 0.2]
hAxes.YBaseline.Visible = 'on';  % default: 'off'
hAxes.XRuler.Axle.Visible = 'off';  % default: 'on'
 
hLine.Color = [1,0,0];  %='red'

rather than using the corresponding set(…) or get(…) functions, which are still supported for backward compatibility.

Customized HG2 plot

Customized HG2 plot

Notice how much more customizable HG2 is compared to HG1. I am pretty excited from the huge number of additional possible customizations in HG2 compared to HG1. It is real a pity that many of these customizations rely on hidden/undocumented properties (see below). Hopefully this will change when HG2 is officially released.

Some observations

Here are a few observations that I collected on the latest HG2, as reflected in R2013a:

  1. Java is still supported (hurray!). The warnings about the figure’s JavaFrame property becoming deprecated have fortunately not been fulfilled (hopefully never). All the Java-based GUI tricks shown on this blog and in my book still work, excluding some minor things here and there which are due to inter-release changes rather than to the new HG2 engine.
  2. In order to access the top-level Java Frame of a figure window, we now need to use javaFrame.fHG2Client rather than javaFrame.fHG1Client. The relevant code should now look something like this, in order to be fully-compatible with older Matlab releases:
    jFrame = get(handle(hFig), 'JavaFrame');
    try
        % This works up to R2011a
        jFrame.fFigureClient.setClientDockable(true);
    catch
        try
            % This works from R2008b and up, up to HG2
            jFrame.fHG1Client.setClientDockable(true);
        catch
            % This works in HG2
            jFrame.fHG2Client.setClientDockable(true);
        end
    end
  3. Anti-aliasing of plot elements (a.k.a. line -smoothing) is now ‘on’ by default (double hurray!). Apparently, MathWorks solved the problems with the existing undocumented LineSmoothing property. Still, for some unknown reason, LineSmoothing remains a hidden/undocumented property. Note that for some objects the property name is different. For example, the axes title (which is a text object of class matlab.graphics.primitive.Text) has a new property called Smoothing that controls anti-aliasing (unlike LineSmoothing, Smoothing appears to be an un-hidden fully-documented property).
    R2013b addendum: The figure handle now includes a property called GraphicsSmoothing that controls anti-aliasing at the entire figure level (default=’on’). No more need to set individual graphic elements, although we still can if we want (alas, this flexibility may be removed soon – see item #6 below). I would have liked to see the anti-aliasing feature use the same property name for all graphic elements, rather than GraphicsSmoothing/LineSmoothing/Smoothing, but maybe I’m just being an ungrateful spoil-sport… The good news about GraphicsSmoothing is that this is a non-hidden property. This means it can be seen with get(gcf) and once HG2 becomes live it will become fully documented/supported – hurray!
  4. Many new properties have been added to graphic objects, that enable customization of different aspects. For example, we can customize the axes grid-lines, containing box and exponent labels in ways that were impossible in HG1 (triple hurray!). Note that many of these new properties are hidden/undocumented (why the hell for???), so we need a utility such as my uiinspect or getundoc to detect them. Some of the useful new axes properties include *Ruler, *Baseline, *GridHandle, BoxFrame and BackDrop (I showed an example usage of *Ruler and *Baseline above). I have absolutely no idea why these so-useful properties are kept hidden, it simply makes no sense.
  5. Some existing HG1 properties are missing. For example, the UserData property is no longer available for some Java objects (this is a real pity — I depended on it for many functionalities, such as storing node-specific data in uitree/JTree nodes). Similarly, axes no longer have *LimInclude properties (this actually makes sense – these properties are still available in plot lines, where they actually have a use).
  6. Some existing HG1 properties now issue a warning, although they still work. For example:
    >> hAxes.DrawMode = 'fast';
    Warning: The DrawMode property will be removed in a future release.
    (Type "warning off MATLAB:hg:willberemoved" to suppress this warning.) 
     
    >> hLine.LineSmoothing
    Warning: The LineSmoothing property will be removed in a future release.
    (Type "warning off MATLAB:hg:willberemoved" to suppress this warning.) 
    ans =
    on

    R2013b addendum: hAxes.DrawMode no longer issues a warning, although hLine.LineSmoothing does.

  7. There is an open bug on R2012b and R2013a whereby the clf function does not delete javacomponent objects. This bug does not affect HG2, where clf works properly.
  8. Some GUI components are being placed a pixel or two sideways in HG2 compared to HG1. This has no visual importance except in very rare cases, but it does affect my findjobj utility, which relies on the component’s position to find its underlying Java object. I have updated findjobj for the upcoming HG2 and it should work with both HG1 and HG2.
  9. The default axes and labels color has changed from black to gray ([0.2 0.2 0.2]). Grid lines now use an even lighter gray shade. Visually I think that this is a great change, since it directs the viewer’s focus on the plot contents rather than the external decorations.
  10. The default axes plot color order has changed. The standard plot color is no longer blue (as it was for ages in Matlab), but a bluish tint; the second color is no longer red but light green; the third color is reddish rather than dark green, etc.:
    % HG1
    >> get(0,'defaultAxesColorOrder')
    ans =
                0            0            1
                0          0.5            0
                1            0            0
                0         0.75         0.75
             0.75            0         0.75
             0.75         0.75            0
             0.25         0.25         0.25
     
    %HG2
    >> get(0,'defaultAxesColorOrder')
    ans =
         0.070588      0.40784      0.70196
          0.92941      0.14118      0.14902
          0.60784       0.7451      0.23922
          0.48235      0.17647       0.4549
                1      0.78039            0
          0.30196       0.7451      0.93333
          0.82353       0.4549            0

    R2013b addendum: The default colors have changed a bit (for the better I think). I still think that the relative order should more closely match the current order (blue-green-red-etc.), for compatibility with existing apps. A small utility function could be added that modifies the color-order to something that may be better suited for color-differentiation (see Tim Holy’s excellent utility for an example).

  11. HG2 axes no longer forget the previous plot color (unless we used hold all) — in HG2 color cycling is on by default. Note that this causes some visual discrepancies between HG1 and HG2 in plots that use hold on and have multiple plot lines: In HG1 they were all blue; in HG2 the first is bluish, the second is greenish, then reddish etc.
  12. GUIDE is still the same-ol’ GUIDE (sigh!). The figure toolbar and menubar have likewise not been upgraded, as far as I could tell.
  13. HG2 performance appears to be generally slower than HG1. Hopefully this will improve by the time HG2 is released, since performance has been one of HG1′s drawbacks all along. In my tests, most GUI/graphic aspects ran only slightly slower in HG2, except for 2D plots that were significantly slower. This is corroborated by running bench: on my computer, HG1 yields 0.4 for 2D and 0.22 for 3D; in HG2 the performance is 2.1 for 2D and 0.18 for 3D. Looks like the 2D performance still needs some work…

Testing HG2

As noted in my original article, we can start Matlab in HG2 mode by simply adding the startup (command-line) switch -hgVersion 2 to the Matlab command (note the space between the -hgVersion and the “2″). For example, in Windows, all you need to do is to copy your Matlab shortcut sideways (so that you will always have the standard HG1 version available), then right-click the shortcut, select “Properties”, then add -hgVersion 2 to the Target field (note the space between “hgVersion” and “2″). You will probably want to also add the “HG2″ descriptor to the shortcut name, in the “General” tab:

Matlab startup switch for HG2

Matlab startup switch for HG2

If you have any Matlab application that relies on GUI or graphics, I urge you to test it on the new HG2 system. It’s trivially simple and your application should work exactly the same, or better. If you do detect some incompatibility, please post a comment or shoot me an email. In due course I expect that MathWorks will open an official channel for this, but in the meantime I’ll be sure to pass the information to the relevant person.

Do take a moment for testing HG2 – we can all contribute to ensure that when HG2 does come out it will be perfect. It’s in our interest.

NYC visit

If you happen to be in New York next week, I urge you to attend the MATLAB Computational Conference on Thursday May 23 (free registration; my presentation is scheduled for 4:50pm). I would be happy to meet you to discuss how I could bring value to your needs, either financial-oriented or not. We could meet at the conference, or anywhere in New York on Wednesday May 22 or Friday May 24.

Matlab Computational Finance Conference - 23 May 2013

 
Related posts:
  1. Plot LimInclude properties The plot objects' XLimInclude, YLimInclude, ZLimInclude, ALimInclude and CLimInclude properties are an important feature, that has both functional and performance implications....
  2. FIG files format FIG files are actually MAT files in disguise. This article explains how this can be useful in Matlab applications....
  3. Panel-level uicontrols Matlab's uipanel contains a hidden handle to the title label, which can be modified into a checkbox or radio-button control...
  4. Performance: accessing handle properties Handle object property access (get/set) performance can be significantly improved using dot-notation. ...
 

A couple of internal Matlab bugs and workarounds

$
0
0

Like any other major software package, Matlab too has its share of bugs. If you ask me, the number of known bugs in Matlab is actually very small compared to the industry standard. Posting bugs online saves the support staff work on duplicates and provides immediate relief for users if the bug happens to have a posted workaround. It also increases transparency, which helps customer loyalty and confidence in the product. Serious engineering work that relies on Matlab for anything from designing cars and planes to trading on stock exchanges needs to be aware of all the current bugs, in order to avoid them in the production code.

Unfortunately, for some reason MathWorks does not publicize all the bugs that it knows about. I know this since there are multiple bugs that I have reported and were confirmed by the competent technical support staff, which do not appear on the online list. I do not know whether this is a deliberate MathWorks policy based on some criteria, but I would hope not and I hope it will be fixed. IMHO, Matlab in general is a very stable system that has absolutely nothing to be ashamed of in terms of the low number, and relatively low-impact, of its open bugs.

Today I write about two internal Matlab bugs that I have recently discovered and reported, along with their workarounds. None of them is really critical, but since neither appears in the official bug parade (as of today), I figured it would do some public good to post them here.

The clf function does not clear javacomponents (1-MNELS1)

The clf function clears the specified figure window (or the current figure [gcf] if no figure handle was specified as input) of any axes and GUI controls. At least, that what it is supposed to do and what it did pretty well until R2012a (Matlab 7.14). Apparently, in R2012b (Matlab 8.0) something broke and controls that are added to the figure window using the javacomponent function are no longer cleared by clf – all the regular Matlab axes and uicontrols are deleted, but not the Java controls.

figure;
[jButton, hContainer] = javacomponent(javax.swing.JButton('Click'), [], gcf); 
drawnow;
clf  % bug - clf does not delete the jButton/hContainer component from the figure

There are several possible workarounds:

  1. Keep the handles of all the relevant Java components, and then delete them directly:
    delete(hContainer)
  2. Use findobj to delete all components, rather than the clf function (we use setdiff to prevent deletion of the figure window itself):
    delete(setdiff(findobj(gcf),gcf))

Note that this bug does not occur when using HG2. However, for users who use the still-standard HG1, this bug is still unfixed as of Matlab R2013b Pre-release (which is now available for download for subscribed users).

GUIDE is unusable with dbstop if error (1-MH5KVI)

In R2013a (Matlab 8.1) I encounter a recurring error when attempting to inspect properties of objects in GUIDE, when “dbstop if error” is turned on.

The error happens when I have “dbstop if error” enabled. This is an enormously helpful debugging tool, so I normally have it turned on in my startup.m file. But in R2013a, if I try to inspect an object’s properties in GUIDE, I see a problem. Matlab hits the breakpoint in %matlabroot%/toolbox/matlab/codetools/+internal/+matlab/+inspector/SceneViewerListener.m line 99 due to the fact that isvalid() is not defined for the object, and the inspector window remains blank.

How to reproduce:

  • run “dbstop if error” in the Matlab command window
  • open a *.fig file in the Matlab command window (e.g., “guide myApplication.fig“)
  • right-click and inspect the properties for an axes (for example)
  • wait for the breakpoint to occur – “K>>” in the command window; the Editor stops (green arrow) in SceneViewerListener.m line 99
  • an empty inspector window is displayed

Analysis:
Because SceneViewerListener is called from Java, not Matlab, the error is thrown as an exception that is trapped by the Java code and therefore does not appear to the user unless “dbstop if error” is on. Here is the full stack trace at the point of error (see this post regarding how to generate the Java stack dump):

K>> dbstack
> In SceneViewerListener>SceneViewerListener.isBeingDeleted at 99
 
K>> st = java.lang.Thread.currentThread.getStackTrace; for idx = 2 : length(st), disp(st(idx)); end
com.mathworks.jmi.NativeMatlab.SendMatlabMessage(Native Method)
com.mathworks.jmi.NativeMatlab.sendMatlabMessage(NativeMatlab.java:219)
com.mathworks.jmi.MatlabLooper.sendMatlabMessage(MatlabLooper.java:120)
com.mathworks.jmi.Matlab.mtFeval(Matlab.java:1540)
com.mathworks.mlwidgets.inspector.JidePropertyViewTable.isBeingDeleted(JidePropertyViewTable.java:154)
com.mathworks.mlwidgets.inspector.JidePropertyViewTable.filterOutInvalidObjects(JidePropertyViewTable.java:170)
com.mathworks.mlwidgets.inspector.JidePropertyViewTable.setObjects_MatlabThread(JidePropertyViewTable.java:187)
com.mathworks.mlwidgets.inspector.PropertyView.setObject_MatlabThread(PropertyView.java:655)
com.mathworks.mlwidgets.inspector.PropertyView.setObject_AnyThread(PropertyView.java:591)
com.mathworks.mlwidgets.inspector.PropertyView.access$1300(PropertyView.java:37)
com.mathworks.mlwidgets.inspector.PropertyView$RegistryHandler.itemStateChanged(PropertyView.java:698)
java.awt.AWTEventMulticaster.itemStateChanged(Unknown Source)
com.mathworks.services.ObjectRegistry.fireItemEvent(ObjectRegistry.java:763)
com.mathworks.services.ObjectRegistry.setSelected(ObjectRegistry.java:700)
com.mathworks.services.ObjectRegistry.setSelected(ObjectRegistry.java:617)
com.mathworks.mde.inspector.Inspector.setSelected(Inspector.java:584)
com.mathworks.mde.inspector.Inspector.inspectObjectArray(Inspector.java:569)
com.mathworks.mde.inspector.Inspector.inspectObjectArray(Inspector.java:520)
com.mathworks.mde.inspector.Inspector$11.run(Inspector.java:478)
com.mathworks.jmi.NativeMatlab.dispatchMTRequests(NativeMatlab.java:347)

Workaround:
replace the existing code of SceneViewerListener.m:

>> edit internal.matlab.inspector.SceneViewerListener
 
...
if ~isvalid(selectedObject)
    beingDeleted = true;
elseif isprop(selectedObject,'BeingDeleted') && strcmp('on',selectedObject.BeingDeleted)
    beingDeleted = true;
elseif ~isempty(ancestor(selectedObject,'figure')) && strcmp('on',get(ancestor(selectedObject,'figure'),'BeingDeleted'))
    beingDeleted = true;
else
    beingDeleted = false;
end

with the following (changed lines are highlighted):

if any(~isobject(selectedObject))    beingDeleted = false;elseif ~isValid    beingDeleted = true;
elseif isprop(selectedObject,'BeingDeleted') && strcmp('on',selectedObject.BeingDeleted)
    beingDeleted = true;
elseif ~isempty(ancestor(selectedObject,'figure')) && strcmp('on',get(ancestor(selectedObject,'figure'),'BeingDeleted'))
    beingDeleted = true;
else
    beingDeleted = false;
end

It looks like this bug was apparently fixed in the R2013b Pre-release without needing to modify SceneViewerListener. But if you still encounter this problem you now know what to do.

I have reported another GUIDE-related bug, but I do not have a workaround for this one: If you run the GUI from within GUIDE, and some uncaught error (exception) occurs, then from that moment onward you cannot save any modifications to the figure file in that session.

Do you know of any other undocumented bugs, preferably with workarounds? If so, please post them in a comment here.

 
Related posts:
  1. Internal Matlab memory optimizations Copy-on-write and in-place data manipulations are very useful Matlab performance improvement techniques. ...
  2. Matlab’s internal memory representation Matlab's internal memory structure is explored and discussed. ...
  3. Solving a Matlab hang problem A very common Matlab hang is apparently due to an internal timing problem that can easily be solved. ...
  4. Images in Matlab uicontrols & labels Images can be added to Matlab controls and labels in a variety of manners, documented and undocumented. ...
 
Viewing all 45 articles
Browse latest View live