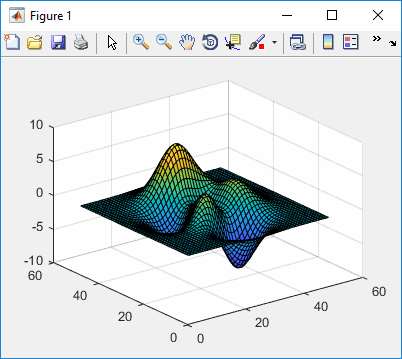
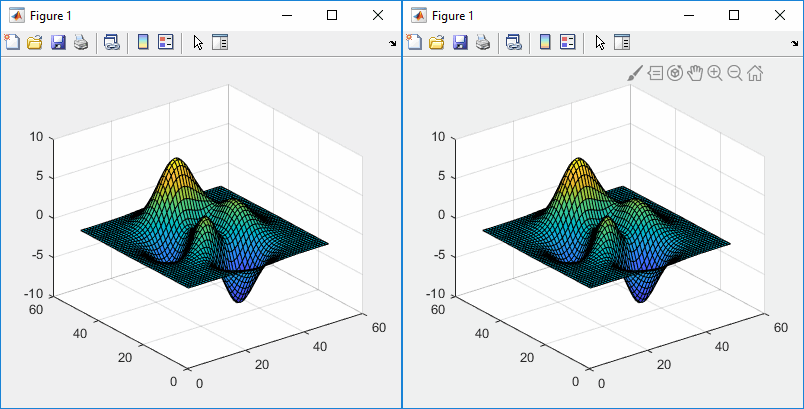
I planned to post a new article in my toolstrip mini-series, but then I came across something that I believe has a much greater importance and impacts many more Matlab users: the change in Matlab R2018b’s figure toolbar, where the axes controls (zoom, pan, rotate etc.) were moved to be next to the axes, which remain hidden until you move your mouse over the axes. Many users have complained about this unexpected change in the user interface of such important data exploration functionality:

R2018a (standard toolbar)

R2018b (integrated axes toolbar)
Luckily, we can revert the change, as was recently explained in this Answers thread:
addToolbarExplorationButtons(gcf) % Add the axes controls back to the figure toolbar

hAxes.Toolbar.Visible = 'off'; % Hide the integrated axes toolbar
%or:
hAxes.Toolbar = []; % Remove the axes toolbar data
And if you want to make these changes permanent (in other words, so that they would happen automatically whenever you open a new figure or create a new axes), then add the following code snippet to your startup.m file (in your Matlab startup folder):
try %#ok
    if ~verLessThan('matlab','9.5')
        set(groot,'defaultFigureCreateFcn',@(fig,~)addToolbarExplorationButtons(fig));
        set(groot,'defaultAxesCreateFcn',  @(ax,~)set(ax.Toolbar,'Visible','off'));
    end
end
MathWorks is taking a lot of heat over this change, and I agree that it could have done a better job of communicating the workaround in placing it as settable configurations in the Preferences panel or elsewhere. Whenever an existing functionality is broken, certainly one as critical as the basic data-exploration controls, MathWorks should take extra care to enable and communicate workarounds and settable configurations that would enable users a gradual smooth transition. Having said this, MathWorks does communicate the workaround in its release notes (I’m not sure whether this was there from the very beginning or only recently added, but it’s there now).
In my opinion the change was *not* driven by the marketing guys (as was the Desktop change from toolbars to toolstrip back in 2012 which received similar backlash, and despite the heated accusations in the above-mentioned Answers thread). Instead, I believe that this change was technically-driven, as part of MathWorks’ ongoing infrastructure changes to make Matlab increasingly web-friendly. The goal is that eventually all the figure functionality could transition to Java-script -based uifigures, replacing the current (“legacy”) Java-based figures, and enabling Matlab to work remotely, via any browser-enabled device (mobiles included), and not be tied to desktop operating systems. In this respect, toolbars do not transition well to webpages/Javascript, but the integrated axes toolbar does. Like it or not, eventually all of Matlab’s figures will become web-enabled content, and this is simply one step in this long journey. There will surely be other painful steps along the way, but hopefully MathWorks would learn a lesson from this change, and would make the transition smoother in the future.
Once you regain your composure and take the context into consideration, you might wish to let MathWorks know what you think of the toolbar redesign here. Please don’t complain to me – I’m only the messenger…
Merry Christmas everybody!
p.s. Once of the complaints against the new axes toolbar is that it hurts productivity by forcing users to wait for the toolbar to fade-in and become clickable. Apparently the axes toolbar has a hidden private property called FadeGroup that presumably controls the fade-in/out effect. This can be accessed as follows:
hFadeGroup = struct(hAxes.Toolbar).FadeGroup % hAxes is the axes handle
I have not [yet] discovered if and how this object can be customized to remove the fade animation or control its duration, but perhaps some smart hack would discover and post the workaround here (or let me know in a private message that I would then publish anonymously).